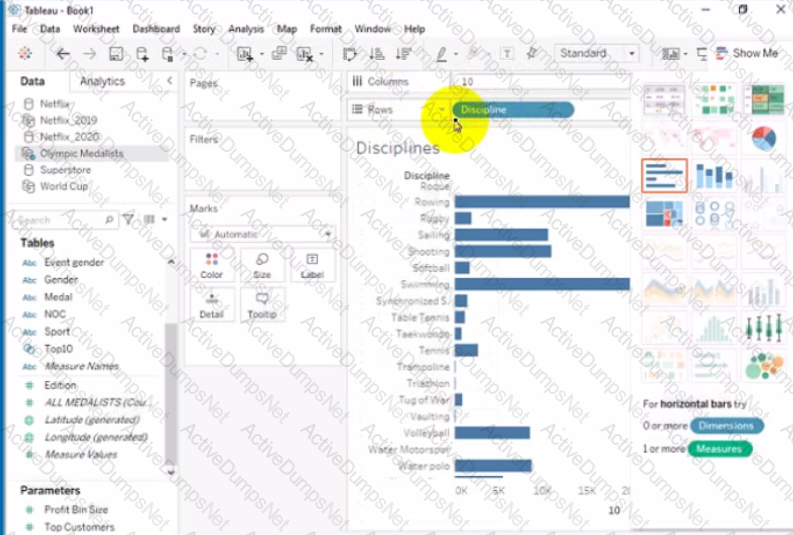
Open the link to Book1 found on the desktop. Open Disciplines worksheet.
Filter the table to show the Top 10 NOC based on the number of medals won.
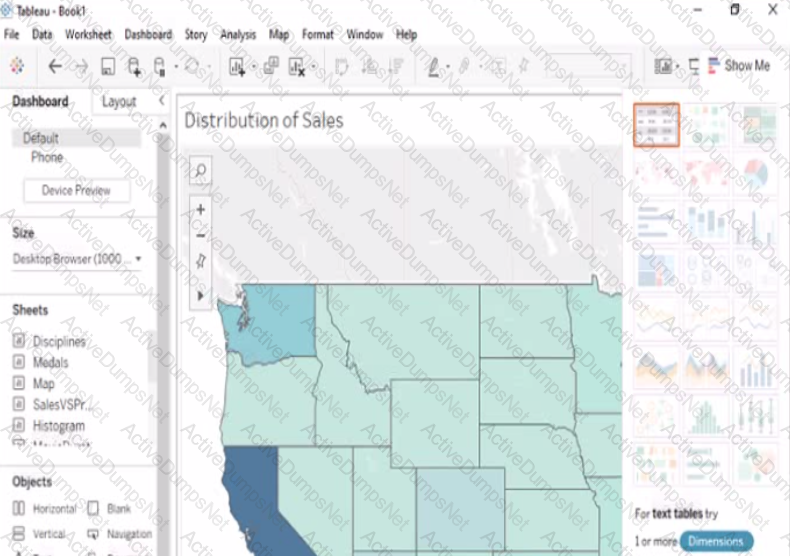
Open the link to Book1 found on the desktop. Open the sales dashboard.
Add the Sales by State sheet in a Show/Hide button to the right side of the dashboard.
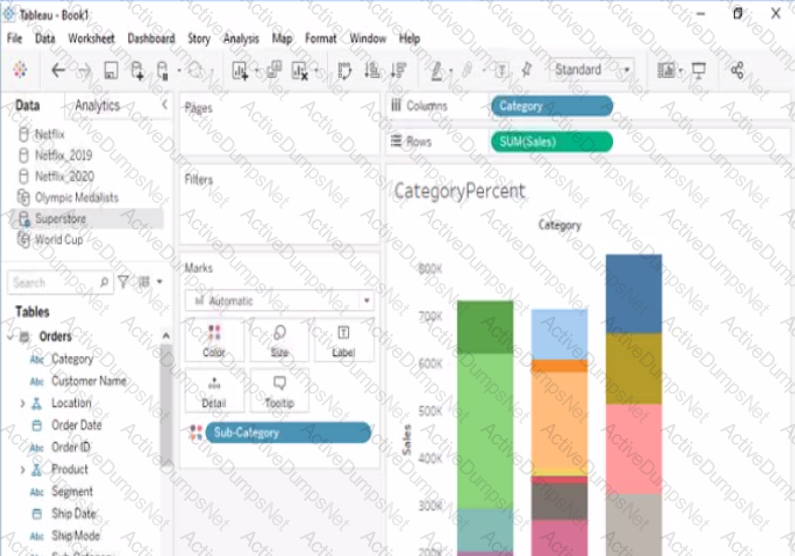
Open the link to Book1 found on the desktop. Open the CategoryPercentage worksheet.
Modify the bar chart show the percentage of sales for each Subcategory within every Category. The total percentage for every Category must be 100%.
Open the link to Book1 found on the desktop. Open Disciplines worksheet.
Filter the table to show the members of the Top10 set and the members of the Bottom10 set. There should be a total of 20 rows.
Open the link to Book1 found on the desktop. Open SalesVSProfit worksheet.
Add a distribution band on Profit to show the standard deviation from- 1 to 1.
Open the link to Book1 found on the desktop. Open the Line worksheet.
Modify the chart to show only main and max values of both measures in each region.
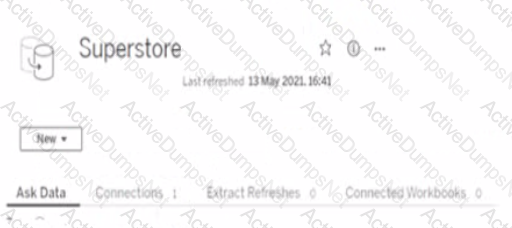
Open the link to Book1 found on the desktop. Use the Superstore data source.
Split the Customer Name field into two fields named First Name and Last Name.
Open the Link to Book1 found on the desktop. Open Map worksheet and use Superstore data source.
Create a filed map to show the distribution of total Sales by State across the United States.
Open the link to Book1 found on the desktop. Open the Histogram worksheet and use the Superstone data source.
Create a histogram on the Quantity field by using bin size of 3.
Open the link to Book1 found on the desktop. Open the Movie Durations worksheet.
Replace the existing data source with the Netflix_2019 data source.
You have the following data source in tableau Server.
You need to ensure that the data is updated every hour.
What should you select?
You have the following dataset.
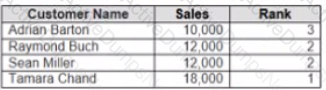
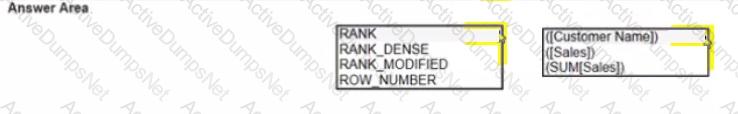
Yon need to calculate the ranking shown in the Rank field.
How should you complete the formula? (Use the dropdowns in the Answer Area to select the correct options to complete the formula ?
You create a parameter named Choose Region fiat contains values from a field named Region.
You want users to be able to use the Choose Region parameter to interact with a chart by logging between different regions
What should you do next?
You have a workbook that connects to a database. The database requires authentication.
You plan to publish the workbook and schedule a daily refresh of the data.
Which two conditions must be met to schedule the refresh? Choose two.
You are creating an annual report in Microsoft Word.
In Tableau Desktop, you build a chart in a worksheet.
You want to create an image of the chart that you can add to the annual report.
What are two ways to create the image? Choose two.
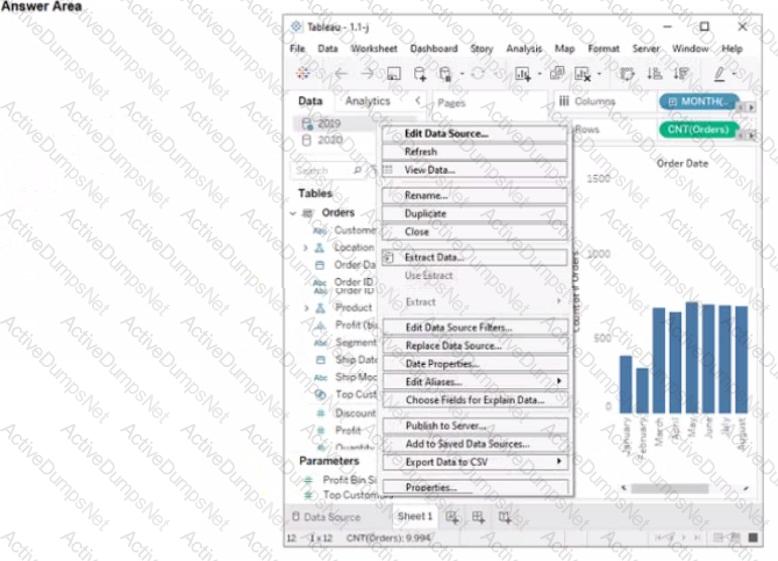
You have two data sources that use the same schema One data source contains order data from 2019 and the other data source contains order data from 2020.
You have a worksheet that shows the orders from 2019.
You need to configure the worksheet to show the orders from 2020 without reloading the data.
Which option should you select?
You have the following tiled dashboard that has one sheet.
You want to replace the sheet with Sheet2.
What should you do?
From Tableau Desktop you sign in lo a Tableau Server site.
What appears in the list of available data sources when you search for a published data source?
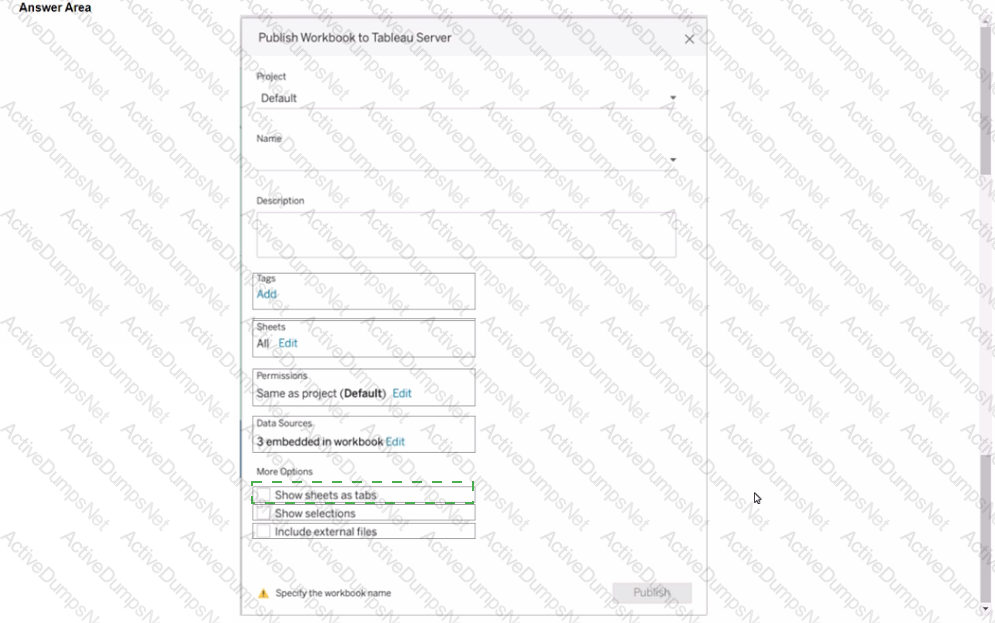
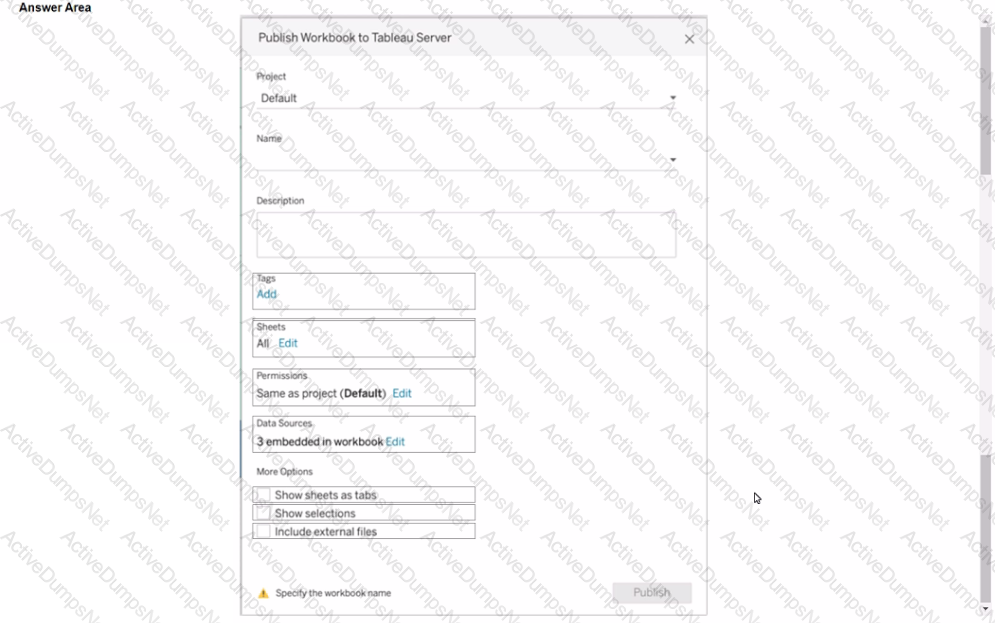
You plan to publish a workbook to Tableau Server.
You want to ensure that users can see other published dashboards from their current dashboard.
Which setting should you configure? (Click the appropriate Option in the Answer Area.)
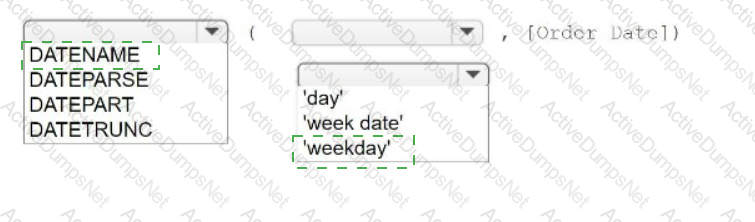
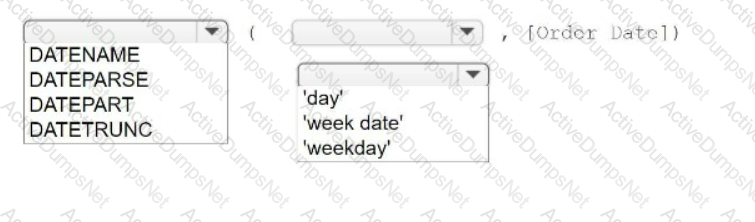
You have a table that contains four columns named Order Date, Country, Sales, and Profit.
You need to add a column that shows the day of the week for each row. For example, orders placed on August 31, 2022, will show a day of
Wednesday.
How should you complete the formula? (Use the dropdowns in the Answer Area to select the correct options to complete the formula.)
You want to add a draft watermark to a dashboard as shown in the following exhibit.
Which type of object should you use?
You have the following bar chart.
You want the chart to appear as shown in the Mowing exhibit.
What should you add?
You have the following visualization.
You Create a table calculation named Rank_Score that has a formula of RANK(AVG([Score]), and you drag Rank_Score to Text on the Marks cards.
What is the Rank Score value for Student ID 4220?
You have the following calculated fields in a worksheet.
[Calc1] = DATEADD ('year', -1, TODAY ())
[Calc2] = DATETRUNC ( 'month' , DATEADD ('year', -1, TODAY ())
You want to calculate the month to date value of the prior year.
How should you complete the formula? (Drag the appropriate Options to the Answer Area and drop into the correct locations.)