Use the following login credentials to sign in
to the virtual machine:
Username: Admin
Password:
The following information is for technical
support purposes only:
Lab Instance: 40201223
To access Tableau Help, you can open the
Help.pdf file on the desktop.
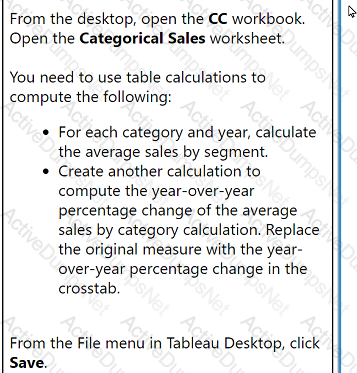
From the desktop, open the CC workbook.
Open the Categorical Sales worksheet.
You need to use table calculations to
compute the following:
. For each category and year, calculate
the average sales by segment.
. Create another calculation to
compute the year-over-year
percentage change of the average
sales by category calculation. Replace
the original measure with the year-
over-year percentage change in the
crosstab.
From the File menu in Tableau Desktop, click
Save.
From the desktop, open the CC workbook.
Open the Incremental worksheet.
You need to add a line to the chart that
shows the cumulative percentage of sales
contributed by each product to the
incremental sales.
From the File menu in Tableau Desktop, click
Save.
From the desktop, open the CCworkbook. Use the US PopulationEstimates data source.
You need to shape the data in USPopulation Estimates by using TableauDesktop. The data must be formatted asshown in the following table.
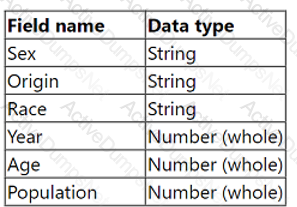
Open the Population worksheet. Enterthe total number of records contained inthe data set into the Total Recordsparameter.
From the File menu in Tableau Desktop,click Save.
From the desktop, open the CC workbook.
Open the Manufacturers worksheet.
The Manufacturers worksheet is used to
analyze the quantity of items contributed by
each manufacturer.
You need to modify the Percent
Contribution calculated field to use a Level
of Detail (LOD) expression that calculates
the percentage contribution of each
manufacturer to the total quantity.
Enter the percentage for Newell to the
nearest hundredth of a percent into the
Newell % Contribution parameter.
From the File menu in Tableau Desktop, click
Save.
From the desktop, open the CC workbook.
Open the City Pareto worksheet.
You need to complete the Pareto chart toshow the percentage of sales compared tothe percentage of cities. The chart mustshow references lines to visualize how thedata compares to the Pareto principle.
From the File menu in Tableau Desktop, clickSave.
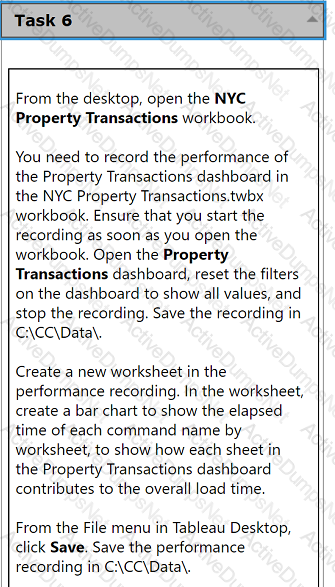
From the desktop, open the NYC
Property Transactions workbook.
You need to record the performance of
the Property Transactions dashboard in
the NYC Property Transactions.twbx
workbook. Ensure that you start the
recording as soon as you open the
workbook. Open the Property
Transactions dashboard, reset the filters
on the dashboard to show all values, and
stop the recording. Save the recording in
C:\CC\Data\.
Create a new worksheet in the
performance recording. In the worksheet,
create a bar chart to show the elapsed
time of each command name by
worksheet, to show how each sheet in
the Property Transactions dashboard
contributes to the overall load time.
From the File menu in Tableau Desktop,
click Save. Save the performance
recording in C:\CC\Data\.
A client has a published dashboard. They change the dashboard and then republish it. Now, usersreport that their web browser bookmarks to the dashboard
are broken.
What are two possible causes for this issue? Choose two.
A client requests a published Tableau data source that is connected to SQL Server. The client needs to leverage the multiple tables option to create an
extract. The extract will include partial data from the SQL Server data source.
Which action will reduce the amount of data in the extract?
A client wants to flag orders that have sales higher than the regional average.
Which calculated field will produce the required result?
A consultant plans a Tableau deployment for a client that uses Salesforce. The client wants users to automatically see Tableau views of regional sales filtered
by customer as soon as the users sign into Salesforce.
Which approach should the consultant use to deliver the final visualization?
A client wants to see data for only the last day in a dataset and the last day is always yesterday. The date is represented with the field Ship Date.
The client is not concerned about the daily refresh results. The volume of data is so large that performance is their priority. In the future, the client will be able
to move the calculation to the underlying database, but not at this time.
The solution should offer the best performance.
Which approach should the consultant use to produce the desired results?
A client currently has a workbook with the table shown below.
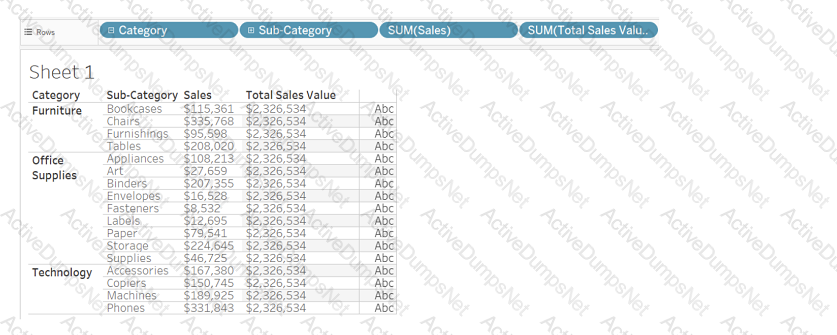
Which method will produce the output for the Total Sales Value field for all the categories shown in the table?
A company has a data source for sales transactions. The data source has the following characteristics:
. Millions of transactions occur weekly.
. The transactions are added nightly.
. Incorrect transactions are revised every week on Saturday.
· The end users need to see up-to-date data daily.
A consultant needs to publish a data source in Tableau Server to ensure that all the transactions in the data source are available.
What should the consultant do to create and publish the data?
A client creates a report and publishes it to Tableau Server where each department has its own user group set on the server. The client wants to limit visibility of
the report to the sales and marketing groups in the most efficient manner.
Which approach should the consultant recommend?
An executive-level workbook leverages 37 of the 103 fields included in a data source. Performance for the workbook is noticeably slower than other workbooks
on the same Tableau Server.
What should the consultant do to improve performance of this workbook while following best practice?
A client is using Tableau to visualize data by leveraging security token-based credentials. Suddenly, sales representatives in the field are reporting that they
cannot access the necessary workbooks. The client cannot recreate the error from their offices, but they have seen screenshots from the field agents. The client
wants to restore functionality for the field agents with minimal disruption.
Which step should the consultant recommend to accomplish the client's goal?