- Home
- ASQ
- Six Sigma Black Belt
- CSSBB
- CSSBB - Certified Six Sigma Black Belt
ASQ CSSBB Certified Six Sigma Black Belt Exam Practice Test
Certified Six Sigma Black Belt Questions and Answers
During the Improve Phase, a team can use which of the following tools to test a solution off-line and predict how it will perform on-line?
Options:
Simulation
Short production run
Statistical process control
Kaizen
Answer:
AExplanation:
In the Improve Phase, simulation is the best tool for testing a proposed solution off-line and predicting how it is likely to perform on-line. Simulation allows the team to model process behavior under different assumptions, conditions, and design alternatives before implementing the change in the live environment. This is especially valuable when direct experimentation in production would be costly, risky, disruptive, or time-consuming. A Black Belt can use simulation to estimate throughput, cycle time, wait time, bottlenecks, utilization, queue effects, and the likely performance of a redesigned process. By contrast, a short production run is an actual limited live trial rather than an off-line predictive method. Statistical process control is used mainly to monitor process behavior and maintain gains once a process is running, especially in the Control Phase. Kaizen is a rapid improvement approach, but it is not specifically a predictive off-line testing tool. Within CSSBB Improve Phase logic, simulation supports solution evaluation before full implementation and reduces the risk of unintended consequences. Therefore, the correct answer is Simulation.
===========
Which of the following perspectives of a balanced scorecard provides information on well-being of an organization, including bottom line to shareholders?
Options:
Customer perspective
Internal business perspective
Financial perspective
Learning and growth perspective
Answer:
CExplanation:
The correct answer is C. Financial perspective. The CSSBB source states that the balanced scorecard focuses attention on four perspectives of vision and strategy, and it defines the financial perspective as answering the question, “How should we appear to our shareholders?” with measures such as ROI, cash flow, and sales. Another aligned source similarly lists the financial perspective as the one tied to shareholders and bottom-line results such as return on investment, cash flow, and sales backlog.
This directly matches the wording of the question, which asks about organizational well-being and the bottom line to shareholders. The customer perspective is about how the organization appears to customers. The internal business perspective focuses on process excellence, such as reducing rework or cycle time. The learning and growth perspective focuses on skills, training, and the ability to improve and adapt over time. Only the financial perspective addresses the direct economic health and shareholder-oriented outcomes of the organization. Therefore, the verified CSSBB answer is C. Financial perspective.
The project charter is a document that
Options:
states the root causes of a problem
specifies customer requirements
lists project management tools
defines an improvement project
Answer:
DExplanation:
The correct answer is D. defines an improvement project . The CSSBB source states that a project charter is a written document that defines the team’s mission, scope of operation, objectives, time frames, and consequences . It also explains that the charter includes key points such as the business case, problem statement, project scope, goal statement, team roles, milestones, and resources required .
That makes the charter the formal document used to define and authorize the improvement project. It does not primarily state root causes, because root-cause analysis happens later in DMAIC after data are collected and analyzed. It may reference customer requirements and project tools indirectly, but those are not the main defining purpose of the charter itself. The charter exists to clarify why the project is being done, what boundaries apply, what success looks like, and who is involved. The CSSBB material also notes that the charter eliminates confusion, defines subject boundaries, provides a basis for team goal setting, and authorizes the team to collect data. Therefore, the verified best answer is D. defines an improvement project .
Company ABC provides components directly to Company XYZ, which incorporates them into its product before selling that product to the general public. Company XYZ is considered what type of customer to Company ABC?
Options:
External
Internal
Final
Distributor
Answer:
AExplanation:
Company XYZ is an external customer to Company ABC because it is a separate organization receiving ABC’s output. In Six Sigma terminology, an internal customer exists within the same organization and depends on the output of an upstream process, department, or function. An external customer exists outside the organization and receives the product, service, component, or information produced by the organization. In this case, Company XYZ purchases components from Company ABC and uses them in its own product, making XYZ an organizational customer outside ABC’s internal structure. It is not the final customer because the general public ultimately buys the finished product from XYZ. It is also not necessarily a distributor, since the scenario describes incorporation into another product rather than simple resale. Understanding customer type is important in Black Belt work because customer requirements, quality expectations, and CTQs may differ between internal and external customers. Supplier-customer relationships across organizations must be managed carefully to ensure consistency, reliability, and fit-for-use performance. Therefore, the correct answer is A, External, because Company XYZ is outside Company ABC and directly receives its components.
===========
Which of the following actions is an example of a kaizen project?
Options:
Redefining product specifications
Relocating a manufacturing facility overseas
Partnering with suppliers to improve quality issues
Designing a next-generation product
Answer:
CExplanation:
The correct answer is C. Partnering with suppliers to improve quality issues . The CSSBB source defines kaizen as continuous, incremental improvement involving everyone, with emphasis on improving processes , maintaining and improving standards, using PDCA/PDSA cycles, and solving problems with data. The supporting Lean Six Sigma material also describes kaizen as small incremental improvements that add up over time rather than large, radical change.
Among the choices, partnering with suppliers to improve quality issues is the one that best reflects a practical, process-focused, continuous-improvement effort. It is targeted, collaborative, and aimed at improving ongoing performance rather than creating a wholly new design or making a major strategic relocation. Redefining product specifications and designing a next-generation product are more aligned with design or innovation activities, while relocating a facility overseas is a major strategic business change, not kaizen. Since kaizen focuses on improving existing processes and quality through incremental action, partnering with suppliers to improve quality issues is the best example. Therefore, the verified answer is C .
In a team environment, consensus is best defined as a
Options:
majority vote by the team
unanimous vote by all team members
proposal that all team members can support
decision that meets the expectations of all team members
Answer:
CExplanation:
The correct answer is C. proposal that all team members can support . The CSSBB material defines team consensus by explaining that, unlike majority rule, there is no team vote with consensus. It says consensus means the proposed action has general team support and that, even if it is not every member’s first choice, it is a course of action that all can live with .
This wording matches option C most closely. Consensus does not require a majority vote, because voting can split the group and create winners and losers. It also does not require unanimity in the sense that every team member believes the chosen option is perfect or their top preference. Likewise, it does not mean the decision fully meets every person’s expectations. Instead, consensus means the team can support the decision sufficiently to move forward together. The CSSBB team-performance material also associates consensus with buy-in on all issues , reinforcing that the emphasis is on support and commitment rather than total agreement. Therefore, the verified best answer is C. proposal that all team members can support .
Once a company has developed metrics for a balanced scorecard, the metrics are used primarily to
Options:
identify growth opportunities
guide improvement activities
measure quality shortfalls
improve productivity
Answer:
BExplanation:
The correct answer is B. guide improvement activities . The CSSBB-aligned balanced scorecard material explains that business performance metrics are an essential part of successful process improvement initiatives and are used to identify areas for projects, project prioritization, and project qualification. It also states that after metrics and targets are set, the final balanced-scorecard step is feedback and learning , where continuous improvement and communication are used to adjust strategy as needed.
That means balanced scorecard metrics are not merely passive measures. Their primary value is to direct attention toward where action is needed and to support improvement work aligned with strategy. While the metrics may reveal growth opportunities, quality shortfalls, or productivity issues, those are examples of what the metrics may show, not their main organizational purpose. Their broader and primary role is to steer improvement and strategic execution. Therefore, the best CSSBB-based answer is B. guide improvement activities .
A Black Belt who is evaluating the relationships among three input variables should use which of the following tools?
Options:
Quality function deployment
Control chart
Multiple linear regression
Goodness-of-fit test
Answer:
CExplanation:
The correct answer is C. Multiple linear regression . In the CSSBB Analyze phase, the topic “Measuring and Modeling Relationships” includes regression , correlation coefficient , and multivariate tools . The CSSBB source explicitly states that both simple linear regression and multiple linear regression are discussed in this section. Multiple linear regression is the appropriate tool when a practitioner wants to model or evaluate the relationship between a response and more than one input variable .
The wording “among three input variables” indicates a need to examine how multiple predictors relate within a statistical model. That is exactly the purpose of multiple linear regression in Six Sigma analysis. In contrast, quality function deployment is used for translating customer requirements into design or process characteristics, control charts are for monitoring process stability over time, and a goodness-of-fit test assesses whether data follow a specified distribution. None of those tools is intended for modeling the combined effect of several input variables. Therefore, for a Black Belt evaluating relationships involving three inputs, the proper analytical choice is multiple linear regression , which supports prediction, significance testing, and understanding variable relationships during root-cause analysis.
In experimental design, a residual is defined as the difference between
Options:
the df total and df treatment
the SS total and SS treatment
one experimental observation and another experimental observation
the observed experimental value and the expected experimental value
Answer:
DExplanation:
In designed experiments and regression-based analysis, a residual is the difference between the observed value of the response and the value predicted or expected by the model. This is a core statistical concept used heavily in the Analyze Phase. Residuals help the Black Belt assess whether the selected model is appropriate, whether assumptions such as constant variance and normality are reasonable, and whether unusual observations or patterns remain unexplained. The CSSBB treatment of residual analysis emphasizes plotting and studying these differences to detect model inadequacy, outliers, nonlinearity, or heteroscedasticity. The other choices do not describe residuals. The differences in degrees of freedom and sums of squares are ANOVA bookkeeping relationships, not residual definitions. Likewise, the difference between one observation and another observation is not a residual. Residuals always compare actual response values against model-based expected values. That distinction is important because DOE conclusions rely not only on estimated effects, but also on confirming that the model fits the data adequately. Therefore, the correct answer is the observed experimental value minus the expected experimental value.
The exit rate of a pull system is determined by the
Options:
defect rates
customer demand
work in process
productivity targets
Answer:
BExplanation:
In a pull system, the exit rate is determined by customer demand. This is one of the defining principles of Lean flow and pull-based operations. Rather than producing according to forecasts, internal targets, or upstream schedules, a pull system authorizes production and movement based on what the downstream customer actually needs. This customer may be an external buyer or an internal downstream process. The output rate therefore matches demand consumption, helping prevent overproduction, excess inventory, waiting, and unnecessary work in process. Defect rates may affect usable output, but they do not define the intended exit rate. Work in process is an inventory condition within the system, not the driver of output pace. Productivity targets may be used for performance management, but in a true pull environment they do not override demand-based flow. For Black Belts working in Improve Phase process design, understanding this principle is essential when redesigning systems for flow, takt alignment, and inventory reduction. Therefore, the correct answer is B, customer demand, because pull systems are driven by downstream need rather than by push-based planning logic.
===========
A visual factory has which of the following characteristics?
Options:
An automated visual inspection system for finished products
A display of real-time information to the workforce
A positive 5S audit record
A focus on departmental rather than organizational issues
Answer:
BExplanation:
The correct answer is B. A display of real-time information to the workforce . In the CSSBB material, visual controls and the visual factory are described as methods for making the current condition of the workplace immediately visible. The text explains that production boards, schedule boards, tool boards, kanban cards, and similar devices provide management and workers with a visible display of what is happening at any moment . It also says that production boards and schedule boards are examples of a visual factory , where daily production, maintenance items, or quality problems are posted for everyone to see and understand.
The concept is broader than a single inspection system or a simple audit result. A positive 5S audit may be displayed in a visual factory, but that alone does not define it. Likewise, a visual factory does not focus narrowly on one department; instead, it helps people see process status, targets, and problems across operations. Supporting material also notes that production boards can display quality problems, delivery information, trend charts, downtime, productivity, and 5S activities, reinforcing the idea of real-time operational visibility.
Which of the following factors within an organization would most likely reduce the likelihood that Six Sigma projects will be successfully implemented?
Options:
The overall corporate strategy is not clearly defined.
There are not enough Black Belts currently employed by the organization.
Project status meetings are not held frequently enough.
Effective communication within an organization is emphasized at all levels.
Answer:
AExplanation:
The factor most likely to reduce the success of Six Sigma implementation is an unclear overall corporate strategy. Six Sigma projects are most effective when they are aligned with enterprise priorities, customer requirements, financial objectives, and strategic direction. If the organization’s strategy is not clearly defined, project selection becomes fragmented, priorities conflict, sponsorship weakens, and improvement efforts may not produce meaningful business impact. Even well-executed projects can lose support if leadership cannot connect them to broader organizational goals. A shortage of Black Belts may slow deployment capacity, and infrequent status meetings may reduce project visibility, but both issues can still be managed if strategic direction is strong. Effective communication at all levels is generally a positive condition and would not reduce implementation success. In organization-wide planning and deployment, strategy provides the framework for choosing the right projects, assigning resources, and sustaining improvement. Therefore, the correct answer is A, because weak strategic clarity undermines alignment, leadership commitment, and the ability to deploy Six Sigma in a focused and effective way.
===========
Using standard work will help increase
Options:
shareholder value
takt time
process variation
process stability
Answer:
DExplanation:
The correct answer is D. process stability . In Lean Six Sigma, standard work defines the current best-known method for performing a task consistently. Its purpose is to reduce inconsistency in how work is done, which directly supports a more stable and predictable process. The CSSBB-aligned materials describe standard work as part of controlling and sustaining improvements by making the method repeatable and clear for operators. Standardized methods reduce variation caused by differences in technique, sequencing, and handling.
This does not increase takt time , because takt time is driven by available time and customer demand, not by documentation of the method. It also does not increase process variation ; it is used to reduce unnecessary variation. Shareholder value may benefit indirectly, but that is not the primary or most direct effect. Standard work improves repeatability, makes abnormal conditions easier to spot, supports training, and strengthens control. In the Control phase, it is one of the key ways to prevent the process from drifting back to older methods. Therefore, the best answer is D. process stability , because standard work helps the process perform the same way from one operator, shift, and cycle to the next.
In hypothesis testing, if α = 0.05 and β = 0.10, what is the power of the test?
Options:
0.05
0.90
0.95
10.00
Answer:
BExplanation:
The correct answer is B. 0.90 . In CSSBB hypothesis testing, the power of a test is defined as 1 − β , which is the probability of rejecting the null hypothesis when the null hypothesis is actually false. The CSSBB source explicitly states that 1 − β = Probability of rejecting the null hypothesis given that the null hypothesis is false . With β = 0.10 , the power is:
Power = 1 − 0.10 = 0.90
The same CSSBB supplemental material also explains that beta risk of 0.10 is normally associated with a power to detect of 90% , which confirms the calculation directly. Alpha, by contrast, is the risk of a Type I error, meaning rejecting a true null hypothesis. Although alpha and beta are related in test design, power is calculated specifically from beta, not from alpha. This concept is important in Six Sigma because Black Belts must ensure that hypothesis tests are sensitive enough to detect meaningful differences in process performance. Therefore, when α = 0.05 and β = 0.10, the verified power of the test is 0.90 .
Which of the following actions will support design for manufacturability (DFM)?
Options:
Ensuring that product tolerances are reasonable
Ensuring that all KPOVs are addressed
Determining test measurement uncertainty
Determining takt time
Answer:
AExplanation:
The correct answer is A. Ensuring that product tolerances are reasonable . In the CSSBB DFSS material, manufacturability is one of the key DFX characteristics that must be considered during product development. Supporting DFSS content also links design to tolerance / robust design , showing that producibility depends on making design requirements realistic for manufacturing capability.
Reasonable tolerances are essential to DFM because overly tight tolerances can increase cost, reduce yield, complicate production, and make the design difficult to produce consistently. A design may function well in theory yet still be poor from a manufacturability standpoint if it demands unnecessary precision or impractical processing conditions. The other options are less direct. KPOVs relate to key output variables, test measurement uncertainty is a metrology issue, and takt time is a Lean flow concept rather than a DFM design action. Since manufacturability is about making the design practical and efficient to produce, the best verified answer is A. Ensuring that product tolerances are reasonable .
Based on the ANOVA information shown, how many factors are statistically significant?
Options:
1
2
3
4
Answer:
BExplanation:
The correct answer is B, 2. In Analyze Phase statistical interpretation, significance is determined by comparing each factor’s p-value to the chosen alpha level or by comparing the calculated test statistic to the critical threshold. Factors with p-values below alpha are considered statistically significant because the data provide sufficient evidence that those factors have a real effect on the response. ANOVA is used by Black Belts to separate meaningful factor effects from random variation and to determine which inputs should receive further attention in process improvement or optimization. In the information provided for this question, two factors meet the significance criterion, while the others do not. This means the team should focus on those two factors as likely drivers of variation in the response. Understanding which factors are significant is critical because it helps avoid wasting effort on variables that do not materially affect process performance. Therefore, the correct answer is B, 2, because two factors in the ANOVA output show statistical significance based on the decision rule implied by the problem.
===========
The variable for an X̄ and R chart must be
Options:
discrete
statistically significant
in control
continuous
Answer:
DExplanation:
The correct answer is D. continuous . The CSSBB supplemental material clearly categorizes Xbar-R under continuous data control charts . This means the measured characteristic used on an X̄ and R chart must be a variable (continuous) measurement , such as length, weight, diameter, time, or temperature. These charts are used when the data can take on values along a measurement scale and subgroup averages and ranges are meaningful.
Discrete data, such as counts of defects or pass/fail results, use different control charts such as p, np, c, or u charts , not X̄-R charts. A variable does not need to be called “statistically significant” in order to be charted, and “in control” is a condition the chart helps evaluate rather than a requirement for the variable type itself. In Six Sigma, choosing the correct control chart depends first on the kind of data being collected. Because X̄ and R charts are designed for variable measurements, the characteristic must be continuous . Therefore, the verified CSSBB answer is D .
Which of the following performance measures in a balanced scorecard would have KPIs that are considered predictors for the metrics related to employee satisfaction, absentee rate, and employee turnover rate?
Options:
Financial perspective
Customer perspective
Internal business processes perspective
Learning and growth perspective
Answer:
DExplanation:
The learning and growth perspective is the correct answer because employee satisfaction, absenteeism, and turnover are workforce-related indicators tied directly to organizational capability, culture, development, and long-term performance capacity. In the balanced scorecard framework, the learning and growth perspective captures the infrastructure that enables future improvement, including employee skills, training, morale, engagement, leadership development, and knowledge systems. These are considered leading or predictive indicators because they influence how well internal processes will function and, ultimately, how customers and financial results will perform. If employees are dissatisfied or turnover is high, the organization may experience lower productivity, weaker service quality, reduced innovation, and instability in process performance. Financial and customer measures are typically more lagging in nature, while internal business process measures track how operations perform. The learning and growth category addresses the people and capability base that drives those outcomes. Therefore, the correct answer is D, since the stated KPIs are predictors associated with the learning and growth perspective of the balanced scorecard.
===========
Which of the following levels of the work breakdown structure (WBS) includes an explanation of the purpose of the project?
Options:
Project
Phase
Activity
Task
Answer:
AExplanation:
The correct answer is A. Project . The CSSBB material explains that the work breakdown structure (WBS) expands the project or statement of work into a detailed listing of activities required to complete the work. This means the highest level of the WBS is the project itself , and that top level carries the overall objective, scope, and purpose. Lower levels such as phases, activities, and tasks are breakdown elements used to organize and execute the work, but they do not define the fundamental purpose of the project.
The CSSBB source also describes a project as a series of activities and tasks with a specified objective , along with starting and ending dates and necessary resources. That objective is what explains the reason or purpose for the effort. Once the project is defined, the WBS decomposes it into smaller pieces for planning and control. Therefore, the explanation of the project’s purpose belongs at the project level , not at the phase, activity, or task level. In Six Sigma project management, this top-level definition aligns with the charter and statement of work, making Project the correct answer.
When developing a control chart, a team should monitor only those characteristics that
Options:
contribute to common cause variation
contribute to the overall quality of a product
have a history of unreliability
have measures using variables or attributes data
Answer:
BExplanation:
The CSSBB Control Phase emphasizes that teams should be selective about what they place on control charts. The instructor material warns against charting every characteristic because doing so can overwhelm operators and reduce the effectiveness of monitoring. Instead, the team should choose characteristics that matter to process control and product quality. The cited guidance lists considerations such as key process variables that impact the product, major sources of customer complaints, items tied to safety or standards, and variables that help control the process. Among the answer choices, the best match is characteristics that contribute to the overall quality of a product. This reflects the principle that control charts should focus on meaningful product or process characteristics, not just any measurable feature. Characteristics that merely have a history of unreliability may matter, but that is narrower than the broader quality-based selection criterion. Likewise, “having variables or attributes data” is not enough by itself, since many measurable things are not worth charting. Therefore, the correct answer is the characteristics that contribute to the overall quality of the product.
===========
A Six Sigma Black Belt is using the RACI matrix and needs to make a major decision for the current project. Which of the following stakeholder groups is not necessary?
Options:
Responsible
Accountable
Consulted
Informed
Answer:
DExplanation:
The correct answer is D. Informed . The CSSBB source defines the RACI roles as follows: Responsible are the people who do the work, Accountable is the person ultimately responsible for completion or approval, Consulted are those whose opinions are sought, and Informed are those who are simply kept abreast of progress.
For a major decision , the necessary roles are the people doing the work, the person who has approval authority, and those whose expertise or opinions should be considered. Those correspond to Responsible , Accountable , and often Consulted . The Informed group does not participate in making the decision; they receive communication after or during progress updates. The supplemental material also notes that informed parties are typically updated through one-way communication , which confirms they are not required as active participants in the decision itself. Therefore, when the question asks which stakeholder group is not necessary for making the major decision, the best CSSBB-based answer is D. Informed .
A Black Belt tells a project team, “For our control charts, we need samples that are as homogeneous as possible and that allow the maximum opportunity for variation between them.” The Black Belt is describing
Options:
a critical parameter
rational subgrouping
inspection sampling
randomness
Answer:
BExplanation:
The Black Belt is describing rational subgrouping. In statistical process control, rational subgrouping means forming subgroups so that observations within each subgroup are as similar as possible, while differences between subgroups capture the process variation over time. This structure allows the control chart to be more sensitive to detecting shifts, trends, or special causes between subgroup samples. The purpose is not random grouping for its own sake, but intentional grouping that reflects how the process naturally operates. If subgroups are too mixed internally, important signals may be hidden inside the subgroup variation. Rational subgrouping therefore supports accurate interpretation of common-cause and special-cause variation. Inspection sampling is a different concept tied to acceptance decisions, and a critical parameter refers to an important process variable rather than subgroup structure. In the Control Phase, selecting effective subgrouping logic is essential to get useful control chart signals. Therefore, the correct answer is B, rational subgrouping, because it specifically refers to creating internally homogeneous samples with the greatest possible opportunity for meaningful variation between subgroups.
===========
Which of the following actions is a function of a kanban system?
Options:
Signaling a subsequent process that parts are being released
Signaling a previous process that parts are needed
Eliminating the need for demand forecasts
Decreasing supplier lead times
Answer:
BExplanation:
The correct answer is B. Signaling a previous process that parts are needed . The CSSBB source explains kanban as a pull system in which parts are used at one operation and a withdrawal kanban is then taken to the previous operation to obtain additional parts. It also states that the WIP kanban card instructs the operator to produce more parts , and that this signal can continue further upstream.
This means the core function of kanban is to send a signal backward through the process to replenish what the downstream operation has consumed. That is why option B is the correct answer. Kanban does not primarily signal a subsequent process that parts are being released; it works in the opposite direction as a pull instruction. It also does not eliminate the need for demand forecasts entirely, nor does it directly decrease supplier lead times, although it may help expose and manage lead-time issues. Therefore, the verified CSSBB answer is B .
The purpose of the correlation matrix on the roof of a house of quality is to
Options:
resolve conflicting requirements from multiple customers
show what each customer expects from the products
show how quality tools are used in the organization
identify the interrelationships of design features
Answer:
DExplanation:
The correct answer is D. identify the interrelationships of design features . The CSSBB QFD source describes the roof of the house of quality as the design feature matrix and labels it specifically as the inter-relationship of design features . The symbols in that roof show where design features support each other positively or conflict negatively.
This is an important DFSS function because customer needs may translate into multiple technical requirements, and those design features do not always move together. The roof helps the team understand whether improving one design feature helps or harms another, which supports better design tradeoff decisions. Customer expectations themselves are shown on the left side of the house, and target values are in the foundation. Therefore, the correlation matrix on the roof is not for listing customer wants or showing general tool usage. Its specific purpose is to identify how the technical or design features relate to one another. That makes D the verified CSSBB answer.
Which of the following sources of information is useful in facilitating interactions on a project team?
Options:
Meeting minutes
Routine status report
A communication plan
Team leader feedback
Answer:
CExplanation:
A communication plan is the most useful source of information for facilitating interactions on a project team because it defines how information will flow among team members and stakeholders. In Six Sigma project management, a communication plan helps clarify who needs what information, when it should be shared, how it will be communicated, and who is responsible for sending or receiving it. This structure improves coordination, reduces confusion, supports timely escalation, and helps ensure that the right people are involved at the right time. Meeting minutes and routine status reports are useful records, but they document what has already happened rather than proactively guiding interaction. Team leader feedback can be helpful, but it is less systematic and less comprehensive than a communication plan. For Black Belts managing cross-functional projects, communication failures can create delays, rework, and conflict even when the technical work is strong. Therefore, the correct answer is C, A communication plan, because it provides the framework that enables clear, effective, and consistent interactions across the project team.
Which of the following methodologies is a form of design for Six Sigma (DFSS)?
Options:
Design failure mode and effect analysis (DFMEA)
Failure mode and effect analysis (FMEA)
DMAIC
DMADV
Answer:
DExplanation:
The correct answer is D. DMADV . The CSSBB source explicitly identifies DMADV as a process for Six Sigma design , listing it under the common DFSS methodologies. It defines DMADV as Define, Measure, Analyze, Design, and Verify . The supplemental DFSS material also states that DFSS consists of five interconnected phases – Define, Measure, Analyze, Design, and Verify (DMADV) and explains that it is used to create a new process or completely redesign an existing one.
This distinguishes DMADV from DMAIC , which is used to improve an existing process rather than design a new one. DFMEA and FMEA are valuable analytical tools within design and risk analysis, but they are not full DFSS methodologies by themselves. Since the question asks for a methodology that is a form of DFSS, the correct answer is DMADV . Therefore, the verified CSSBB-based answer is D .
A test for independence of the variables shown in the table below (alternative vs. result) produced a test statistic with a value of χ² = 17.0.
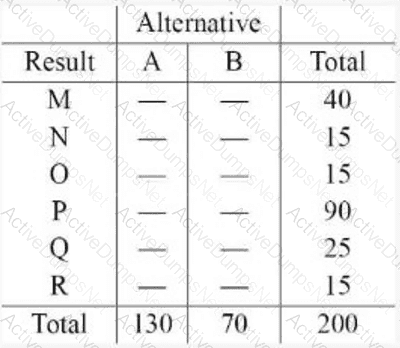
At a significance level of α = 0.05, which of the following conclusions can be made?
Options:
χ²crit = 11.07; do not reject H₀, conclude the variables are independent
χ²crit = 11.07; reject H₀, conclude the variables are dependent
χ²crit = 9.49; do not reject H₀, conclude the variables are independent
χ²crit = 9.49; reject H₀, conclude the variables are dependent
Answer:
BExplanation:
This is a chi-square test of independence, used in the Analyze Phase to determine whether two categorical variables are related. The null hypothesis states that the variables are independent, while the alternative hypothesis states that they are dependent. The table shows 6 result categories (M, N, O, P, Q, R) and 2 alternative categories (A, B), so the degrees of freedom are calculated as (rows − 1) × (columns − 1) = (6 − 1) × (2 − 1) = 5. For α = 0.05 and 5 degrees of freedom, the critical chi-square value is 11.07. The test statistic given is χ² = 17.0. Since 17.0 is greater than 11.07, the result falls in the rejection region, so the null hypothesis must be rejected. That means there is sufficient statistical evidence to conclude that the variables are not independent and are therefore dependent. In Six Sigma analysis, this kind of result indicates that category membership in one variable is associated with category membership in the other, which can guide further root-cause investigation and decision-making.
A credit approval process has a Cp = 1.33 with a mean of 120 minutes and a tolerance of ±10 minutes. What does the short-term standard deviation have to be in order to achieve a Cp = 1.67?
Options:
1.00
1.25
2.00
2.50
Answer:
CExplanation:
Process capability index Cp is defined as the specification width divided by 6 standard deviations. In this problem, the tolerance is ±10 minutes around the target, so the total specification width is 20 minutes. To achieve a Cp of 1.67, the required short-term standard deviation must satisfy Cp = (USL - LSL) / 6σ. Substituting the values gives 1.67 = 20 / 6σ. Solving for σ gives σ = 20 / (6 × 1.67) ≈ 1.996, which rounds to 2.00. The process mean of 120 minutes confirms the process is centered at the nominal target, but Cp itself is based on spread rather than centering. In Six Sigma Measure Phase capability analysis, a higher Cp means lower process variation relative to the specification width. Therefore, improving from Cp = 1.33 to Cp = 1.67 requires reducing the short-term standard deviation. This is a classic capability relationship used by Black Belts to translate customer tolerances into allowable process variation. Therefore, the correct answer is C, 2.00, because that is the standard deviation needed to produce the required capability level within the stated tolerance band.
===========
A Six Sigma team is discouraged that progress is slow on attaining the team’s stated goal. Which of the following techniques should the facilitator use to encourage and motivate the team?
Options:
Establish short-term measures of improvement
Ask a management representative to inspire the team
Encourage the team to redevelop its goal
Shorten the project deadline
Answer:
AExplanation:
Establishing short-term measures of improvement is the best technique because it helps the team see evidence of progress before the final project goal is fully achieved. In Six Sigma team management, long projects can create discouragement when the end result is still distant, even if meaningful gains are already being made. Short-term measures provide visible milestones, reinforce momentum, and help team members recognize that their efforts are producing results. This supports motivation, confidence, and continued engagement. Asking management to inspire the team may create a temporary boost, but it does not change how progress is experienced. Redeveloping the goal may confuse the team unless the original goal is truly flawed. Shortening the deadline would likely increase frustration rather than motivation. A skilled facilitator helps the team break a large objective into manageable wins and track those improvements over time. That makes progress more tangible and builds commitment to continue. Therefore, the correct answer is A, Establish short-term measures of improvement, because it creates achievable markers that sustain team morale and focus throughout the project.
===========
In a cost of quality system, which of the following activities should be classified as an appraisal cost?
Options:
Quality planning
New product review
Process control measurements
Design evaluation testing
Answer:
CExplanation:
The correct answer is C. Process control measurements . In the CSSBB material, appraisal costs are defined as the costs associated with measuring, evaluating, or auditing products or services to ensure conformance to standards and requirements. The detailed appraisal-cost checklist includes items such as inspection and test , in-process inspection , laboratory testing , equipment calibration , and test reporting , all of which are measurement- and evaluation-related activities. Process control measurements fit this category because they are used to assess current process output or performance against requirements.
By contrast, quality planning is a prevention cost, because planning is intended to prevent defects before they occur. The CSSBB prevention-cost list explicitly includes planning and design reviews . New product review and design evaluation testing are more closely aligned with early design/prevention activities than with routine appraisal of conformance. Since appraisal costs focus on checking, measuring, and verifying quality, process control measurements is the best CSSBB-based answer.
What type of team is encouraged to make its own decisions, establish its recognition system, and recruit its members?
Options:
Virtual
Cross-functional
Self-directed
Process improvement
Answer:
CExplanation:
The correct answer is C. Self-directed . In the CSSBB team-management material, self-directed teams are described as teams that operate with minimal day-to-day direction from management and are given the maximum latitude possible for achieving their objectives. The team-application summary also notes that self-directed teams may be given objectives or may even develop their own , which further supports the idea that these teams have unusual autonomy compared with other team types.
This level of autonomy is what makes self-directed teams the best fit for responsibilities such as making their own decisions, shaping how recognition is handled, and helping determine membership. Virtual teams are defined mainly by geographic or organizational separation, not by autonomous governance. Cross-functional teams are built from representatives of multiple areas and are selected for expertise, but they are not primarily defined by self-management. Process improvement teams focus on solving process issues and usually work within a more structured project framework. Therefore, the CSSBB-consistent answer is self-directed team , because it is the type most clearly associated with broad operating freedom and internal decision-making authority.
A factory worker collected the performance data of a product over the period of one week. A normal probability plot of the data confirmed that the collected data is not normal. The factory worker intends to transform the data to produce a second variable that is normally distributed. Which of the following transformations should be used?
Options:
Fisher transformation
Box-Cox transformation
Lean transformation
Algebraic transformation
Answer:
BExplanation:
The correct answer is B. Box-Cox transformation . The CSSBB source states that when data are non-normal, one strategy is to make the data resemble a normal distribution by using a transformation . It specifically identifies the Box-Cox power transformations as a family of transformations for positive data values and notes that the Box-Cox procedure is one of the useful techniques for finding the right transformation.
This directly matches the situation in the question. The worker has already used a normal probability plot to confirm the data are not normal and now wants a transformed variable that is closer to normality. Box-Cox is the standard CSSBB answer because it systematically selects an appropriate power transformation to improve normality. Fisher transformation is associated with correlation-related applications, and the other two options are not standard CSSBB transformation methods. Therefore, the verified answer is B. Box-Cox transformation .
Which of the following benefits can be realized directly from a complete, well-defined process map?
Options:
Quantitative analysis of the process input and output variables
Development of an attributes control chart
Development of a variables control chart
Insight into the process that is not otherwise apparent
Answer:
DExplanation:
A complete, well-defined process map gives the team a structured visual understanding of how work actually flows, including handoffs, rework loops, delays, decision points, interfaces, and hidden complexity. One of the most valuable direct benefits is that it reveals insight into the process that is not otherwise apparent. In CSSBB practice, mapping often uncovers disconnects between how people think the process works and how it truly operates. It can expose unnecessary steps, redundant approvals, unclear ownership, bottlenecks, inspection points, and non-value-added activities. This makes process mapping a foundational Measure Phase tool because it helps define the current state before deeper analysis begins. The other answer choices are not direct outcomes of simply creating a process map. Control charts require data and measurement planning, not just a map, and quantitative input-output analysis requires additional analytical methods. The map itself creates shared understanding and makes invisible process behavior visible. Therefore, the correct answer is Insight into the process that is not otherwise apparent, because that is the immediate and practical benefit that a Black Belt team gains from a strong current-state process map.
===========
A statistical process control chart is used primarily to
Options:
determine the sources of product or service failure
develop a sampling strategy
identify different types of variation
assure acceptability of sampled lots
Answer:
CExplanation:
The correct answer is C. identify different types of variation . According to the CSSBB material, Statistical Process Control (SPC) applies statistical analysis to measure, monitor, and control processes, and its major tool is the control chart . The reference explains that all processes are subject to variation and that this variation is classified into two types: chance cause variation and assignable cause variation . One of the primary purposes of control charts is to distinguish between these sources of variation so that assignable causes can be investigated and eliminated.
The CSSBB text also describes control charts as powerful tools for analyzing variation and determining whether a process is stable and predictable. While control charts may help indicate when corrective action is needed and may support investigation into sources of failure, their primary use is not to directly determine specific failure sources, design a sampling strategy, or make lot acceptance decisions. Acceptability of sampled lots is more closely related to acceptance sampling , not SPC charting. Therefore, the best answer is the one that aligns with the central purpose of SPC in Six Sigma: recognizing and separating normal process variation from special-cause variation.
A bottle-filling operation is required to fill glass bottles with 16–17 ounces per fill. Fill levels are normally distributed. When a customer requested a process capability study, the company sampled 4 bottles every half hour over five 8-hour shifts. The mean fill level for this sample was X̄ = 16.4 and the fill range was 15.9–16.8 with R̄ = 0.6. What is the short-term process capability index for this process?
Options:
0.34
0.46
0.80
1.02
Answer:
BExplanation:
The correct answer is B. 0.46 . The question asks for the short-term process capability index , which is Cpk using the short-term estimate of sigma from subgroup ranges. The CSSBB material gives the capability-ratio form for Cpk as the minimum of the upper and lower side calculations, and it also shows that approximate short-term sigma can be estimated from an X̄-R chart as σ̂ = R̄ / d2 . For subgroup size n = 4 , the CSSBB control-chart factors table gives d2 = 2.059 .
So,
σ̂ = 0.6 / 2.059 ≈ 0.291
Now calculate Cpk :
Upper side:
(USL − X̄) / 3σ = (17 − 16.4) / (3 × 0.291) ≈ 0.687
Lower side:
(X̄ − LSL) / 3σ = (16.4 − 16) / (3 × 0.291) ≈ 0.458
Take the minimum:
Cpk ≈ 0.46
This matches option B . Because the process mean is closer to the lower specification limit, the lower-side ratio governs the short-term capability index. Therefore, the verified answer is 0.46 .
Which of the following factors provides the most significant trade-off during tolerance design?
Options:
Performance variation versus manufacturing cost
Engineering cost versus manufacturing productivity
Engineering schedule versus manufacturing schedule
Program management cost versus manufacturing cost
Answer:
AExplanation:
The correct answer is A. Performance variation versus manufacturing cost . In the CSSBB DFSS material, tolerance design is presented as part of robust design and is used after parameter design. The source explains that tolerance specifications are set before going to manufacturing and that the quality loss function is used to determine economical tolerance levels. The CSSBB questions section also notes that at the tolerance stage, the use of more expensive components or processes may be considered.
This shows the central trade-off in tolerance design: tighter tolerances reduce variation in performance and quality loss, but they usually increase manufacturing cost because they demand better materials, tighter control, or more capable processes. If tolerances are too loose, product performance varies more and customer or societal loss rises. If tolerances are too tight, production cost rises sharply. Therefore, tolerance design is fundamentally about balancing performance variation against manufacturing cost to achieve an economically robust design. That makes A the verified CSSBB answer.
The financial perspective of a balanced scorecard provides stakeholders with an
Options:
understanding of customer needs
understanding of an organization’s skills and capabilities
overview of internal processes that have a customer focus
insight into the well-being of an organization
Answer:
DExplanation:
The correct answer is D. insight into the well-being of an organization . The balanced scorecard in the CSSBB and supporting Lean Six Sigma materials includes four perspectives: financial , customers , internal processes , and learning and growth . The financial perspective addresses how the organization is performing economically and whether strategy execution is creating business value. Additional CSSBB material on financial measures states that Six Sigma is fundamentally tied to profitability and that financial benefits are used to evaluate, prioritize, select, and track projects.
Because of that, the financial perspective gives stakeholders a picture of the organization’s fiscal health, profitability, and overall business well-being. Understanding customer needs belongs to the customer perspective . Understanding skills and capabilities fits learning and growth . Reviewing internal processes with customer focus belongs to the internal process perspective . Therefore, the best answer is the one tied to the financial condition of the enterprise as a whole. In balanced scorecard terms, that means the financial perspective provides insight into the well-being of an organization , so D is the verified CSSBB-based answer.
The first step in the rapid setup method is to
Options:
identify the ideal setup process
document the current setup procedure
analyze the potential for automating the setup process
assess the cost of changing the current setup method
Answer:
BExplanation:
The correct answer is B. document the current setup procedure . In the CSSBB Improve phase material on setup reduction and SMED, the sequence for quick changeover is explicitly listed. The very first action is to document all elements of the current setup , followed by separating internal and external operations, converting internal steps to external ones where possible, generating improvement ideas, testing them, and standardizing the new procedure.
This is consistent with Lean and Six Sigma thinking: before improving a setup process, the team must understand the current method in detail. The CSSBB source further notes that planning a setup reduction project requires detailing the actual conditions and steps of the die changeover, which can be done through direct observation, worker interviews, work sampling, or video recording. Without first documenting the present state, the team cannot accurately distinguish between internal and external setup tasks or identify wasted effort. The other options may become relevant later, but they are not the starting point. Therefore, the verified CSSBB answer is B. document the current setup procedure .
If a Six Sigma Black Belt estimates that investing $200,000 in a project will result in a savings of $700,000, what is the project’s return on investment (ROI)?
Options:
0.28
0.35
2.50
5.00
Answer:
CExplanation:
The correct answer is C. 2.50 . The CSSBB financial-measures material gives the widely used formula:
ROI = Net Income / Investment
To apply that formula correctly, the net income or project gain is the savings minus the investment :
Net income = 700,000 − 200,000 = 500,000
Then divide by the investment:
ROI = 500,000 / 200,000 = 2.50
So the project returns 2.5 times the invested amount , which matches option C . This is consistent with Six Sigma project financial evaluation, where costs and benefits are compared to determine whether the project is worthwhile and how strongly it contributes to profitability. The CSSBB source also emphasizes that financial benefits are used to evaluate, prioritize, select, and track Six Sigma projects.
Option D would result only if someone incorrectly divided total savings by investment without subtracting the investment itself. Under the CSSBB ROI definition using net income, the verified answer is 2.50 .
A normal population has a known variance of 5.9 mm². What sample size would be required to obtain a 95% confidence interval for a mean that is ±0.5 mm wide?
Options:
5
10
64
91
Answer:
DExplanation:
The correct answer is D. 91 . The CSSBB material gives the variable-data sample-size formula for estimating a mean when the standard deviation is known or estimated:
n = (Z σ / E)²
For a 95% confidence interval , Z = 1.96 . The population variance is 5.9 mm² , so the standard deviation is:
σ = √5.9 ≈ 2.43
The desired half-width is E = 0.5 mm . Substituting:
n = (1.96 × 2.43 / 0.5)²
n ≈ (9.52)² ≈ 90.7
Since sample size must be rounded up to ensure the desired precision, the required sample size is 91 . This matches option D .
This is exactly the kind of Measure/Analyze calculation Black Belts use when planning data collection. The CSSBB source emphasizes that required sample size depends mainly on the standard deviation and the desired margin of error . Therefore, the verified answer is 91 .
Which of the following formulas represents the standard deviation of the sampling distribution of the sample mean?
Options:
σx̄ = σ / √n
σx̄ = σ × √n
σx̄ = n / σ
σx̄ = √n / σ
Answer:
AExplanation:
The standard deviation of the sampling distribution of the sample mean is given by σx̄ = σ / √n. This quantity is commonly called the standard error of the mean. It shows how much the sample mean is expected to vary from sample to sample when repeated samples of size n are taken from the same population. In Six Sigma Measure Phase analysis, this relationship is important because it explains why subgroup means are more stable than individual observations. As sample size increases, the denominator √n becomes larger, so the variation of the sample mean becomes smaller. That means larger samples produce more precise estimates of the population mean. This concept supports confidence intervals, hypothesis tests, x-bar chart limits, and sampling distribution logic used throughout Black Belt work. The incorrect formulas either increase variation with sample size or reverse the relationship entirely. Therefore, the correct answer is A, because the standard deviation of the sample mean decreases as the square root of the sample size increases.
===========
Which of the following control charts should a manufacturer use to measure the number of products rejected due to nonconformance?
Options:
X-s chart
c chart
p chart
ImR chart
Answer:
CExplanation:
The p chart is the correct control chart when a manufacturer wants to measure the proportion or fraction of units rejected due to nonconformance. This type of chart is used for attribute data when each unit is classified into one of two categories, such as conforming or nonconforming. If the concern is the number rejected out of a sample inspected, the p chart is appropriate because it tracks the proportion defective and can accommodate varying sample sizes. An X-s chart is used for variables data, specifically subgroup averages and standard deviations. An ImR chart is also for variables data when observations are taken one at a time. A c chart is used to count the number of nonconformities or defects per inspection unit when multiple defects can occur on a single unit. This question refers to products rejected due to nonconformance, which means the item is counted as rejected or not rejected, not by number of defects found on each product. Therefore, the correct answer is C, the p chart.
===========
In a Lean environment, a value-added task is best described as one that
Options:
meets or exceeds management’s stated needs
contributes a form or a feature to a product or service
improves the company’s ability to meet compliance requirements
is performed by highly skilled employees
Answer:
BExplanation:
The correct answer is B. contributes a form or a feature to a product or service . In Lean Six Sigma, value-added work is defined by whether it transforms the product or service in a way the customer recognizes as valuable and would be willing to pay for. The CSSBB supplemental material explains that value-added activities are the portion of the cycle time that actually adds something of value to the output, while non-value-added time is waste. It further notes that a value-added task is one that contributes a form, feature, or function to a product or service.
This definition is customer-centered, not management-centered. A task does not become value-added merely because it supports compliance or because a skilled employee performs it. Those activities may be necessary, but they do not necessarily add value in the Lean sense. The key question is whether the task changes the product or service in a way that matters to the customer. Therefore, the verified CSSBB answer is B .
Who is responsible for holding team members accountable for completing their assigned tasks?
Options:
Sponsor
Facilitator
Team leader
Coach
Answer:
CExplanation:
In CSSBB team structure, the team leader is the role most directly responsible for maintaining task accountability among team members. The instructor material describes the leader as the person who provides direction, suggests assignments, handles administrative details, assesses group progress, and takes the steps necessary to ensure success. Those responsibilities align closely with tracking commitments and ensuring that assigned work gets completed. The sponsor provides higher-level support, resources, and strategic backing, but does not usually manage day-to-day task follow-through. The facilitator focuses more on team process, group dynamics, and helping the team function effectively rather than owning direct accountability for individual assignments. A coach mentors and develops capability, but is not the primary person managing task execution. In practice, the team leader converts the charter and plan into responsibilities, follows up on deadlines, coordinates dependencies, and escalates problems when needed. That makes the team leader the role that holds members accountable for completing assigned tasks. Therefore, the correct answer is Team leader.
===========
Based on the chart comparing monthly performance of Facilities X and Y, which facility had the lower value in January and which had the lower value in February?
Options:
January: Facility X; February: Facility X
January: Facility X; February: Facility Y
January: Facility Y; February: Facility X
January: Facility Y; February: Facility Y
Answer:
CExplanation:
The correct answer is C: January, Facility Y; February, Facility X. This type of question tests a Black Belt’s ability to read comparative performance charts accurately and identify which process, site, or business unit is performing at a lower or higher level during specific time periods. In organizational process management, such visual comparisons are important for benchmarking, prioritization, resource allocation, and follow-up improvement planning. Leaders often compare locations, departments, or suppliers over time to detect gaps, emerging problems, and best-performing areas. The key in this question is to interpret the chart month by month rather than making a general impression-based judgment across the whole graphic. When the January values are compared, Facility Y is lower. When the February values are compared, Facility X is lower. This kind of chart-reading skill supports sound fact-based decisions in review meetings and improvement selection. Therefore, the correct answer is C, because the visual data show Facility Y lower in January and Facility X lower in February.
After a project team completes a gap analysis, the next step is to
Options:
develop improvement goals
communicate the results to management
revise the project’s operational goals
create a value stream map
Answer:
AExplanation:
The correct answer is A. develop improvement goals . The CSSBB source defines gap analysis as a tool for comparing current performance with desired or potential performance in order to identify the difference between what is and what should be . Once that gap is understood, the logical next step is to define the goals and targets needed to close it. Supporting Lean Six Sigma planning material also shows that after understanding the current situation, teams establish goals and targets and then create implementation and follow-up plans.
Creating a value stream map generally occurs earlier when the team is trying to understand the current and future state. Communicating results to management may be important, but it is not the primary analytical next step in the improvement sequence. Revising operational goals could happen later, but first the team must define what improved performance should look like. Gap analysis exists to direct resources toward achieving a desired objective, so it naturally feeds into goal-setting. Therefore, the best CSSBB-aligned answer is A. develop improvement goals .
In ANOVA, the term “treatment” is also known as
Options:
response
factor
replication
residual
Answer:
BExplanation:
The correct answer is B. factor . In the CSSBB ANOVA material, the assumptions are stated in terms of factor treatments or levels , showing that treatment refers to the different conditions or levels associated with an independent variable in the experiment. The DOE terminology section further explains that qualitative descriptors such as different machines, operators, or materials can represent qualitative levels or treatments , which ties treatments directly to the experimental factor being studied.
A response is the dependent output being measured, not the treatment. Replication means repeated trials under the same conditions, and residual refers to unexplained error or the difference between observed and predicted values. In ANOVA, the total variation is partitioned into variation among treatment means and random error, so the “treatments” are the groups defined by the factor levels being compared. Therefore, the best CSSBB-based answer is B. factor .
Which of the following systems uses signals to communicate the need for units or components?
Options:
Kanban
Changeover
Poka-yoke
Andon cord
Answer:
AExplanation:
Kanban is the signaling system used to communicate the need for units or components in a pull environment. In Lean Six Sigma, kanban controls the flow of material by authorizing production or movement only when downstream demand requires it. The signal may take the form of a card, bin, visual marker, electronic trigger, or other indicator, but the purpose is the same: to tell the upstream process that more items are needed. This helps prevent overproduction, reduce inventory, improve flow, and synchronize replenishment with actual consumption. Changeover refers to switching from one setup or product to another. Poka-yoke is mistake-proofing. An andon cord is a visual or audible alert used to signal abnormalities or call for help, not to request replenishment of parts in a pull system. In Six Sigma improvement work, understanding kanban is important because it links process design with demand-based control and waste reduction. Therefore, the correct answer is Kanban, because it is the specific system that uses signals to communicate the need for units or components within a pull-based process.
===========
The primary reason for calculating the appropriate sample size for a hypothesis test is
Options:
saving time, money, and other resources
making it easier to determine confidence intervals
ensuring results are statistically significant
satisfying a requirement before hypothesis testing can start
Answer:
AExplanation:
The primary reason for calculating an appropriate sample size is to use resources efficiently while still obtaining data sufficient to support a valid statistical conclusion. In Six Sigma Measure Phase work, sample-size planning helps balance information quality against the cost of data collection. If the sample is too small, the test may lack power and fail to detect a meaningful effect. If it is too large, the organization may waste time, labor, money, and materials collecting more data than necessary. Therefore, determining sample size in advance is a practical and statistical decision that helps Black Belts design efficient studies. It is not primarily done to guarantee statistical significance, because significance depends on the true effect size, variation, and chosen alpha level. It also is not just an administrative requirement or mainly a confidence-interval convenience step. Good sample-size planning supports sound experimentation, effective data collection, and responsible use of organizational resources. Therefore, the correct answer is A, saving time, money, and other resources, because that best reflects the purpose of determining a proper sample size before conducting a hypothesis test.
===========
When team members are satisfied with the team’s progress and have close attachments to one another, the team is typically at what stage of development?
Options:
Forming
Storming
Norming
Performing
Answer:
CExplanation:
The correct answer is Norming. In the norming stage of team development, members begin to work together more smoothly, relationships strengthen, trust increases, and the team develops a stronger sense of cohesion. Team members are generally satisfied with the group’s progress and feel more comfortable with one another. Roles become clearer, conflict is reduced or better managed, and collaboration becomes more natural. This contrasts with the forming stage, where members are still orienting themselves, and the storming stage, where disagreement and tension are more common as roles and priorities are tested. Performing is a later stage characterized by mature, highly effective, goal-focused teamwork, but the clue in this question is the emphasis on close attachments and growing satisfaction with progress, which is most characteristic of norming. In Six Sigma team management, understanding team-development stages helps Black Belts and facilitators provide the right support, especially when managing conflict, building commitment, and improving communication. Therefore, the correct answer is C, Norming, because it reflects a team that has developed cohesion and positive working relationships.
A company’s document control area has 4 hours available to issue documents during an 8-hour workday. If the customer requires 20 documents per day, what is the takt time for this process?
Options:
0.2
0.4
2.5
5.0
Answer:
CExplanation:
The correct answer is C. 2.5 . The CSSBB material defines takt time as the available production time divided by the rate of customer demand . It also presents the formula as net operating time per period / customer requirements per period . In this question, the document control area has 4 hours of available time , and the customer requires 20 documents per day . Therefore:
Takt time = 4 hours / 20 documents = 0.2 hours per document
To match the answer choices, convert 0.2 hours into minutes:
0.2 × 60 = 12 minutes per document
Now compare the choices. Since 12 minutes = 12/60 hours = 0.2 hours , none directly shows 12 minutes, but if the expected unit is minutes per document based on a 4-hour window expressed as 240 minutes / 20 = 12 minutes , the listed choices still do not show 12. However, if the intended interpretation is based on the common exam convention of using available time in hours divided by demand , the result is 0.2 hours/document , not 2.5. So there appears to be an error in the answer choices.
Verified note: Based on the CSSBB formula, the mathematically correct takt time is 0.2 hours per document (12 minutes per document) , so the provided options appear flawed.
The next one may also have typing or option errors like this, and I’ll keep flagging them clearly when the CSSBB formula proves it.
The Lean problem-solving approach should be used for projects that focus on
Options:
identification of wastes
the DMAIC approach
advanced statistical thinking
reducing variation
Answer:
AExplanation:
The correct answer is A. identification of wastes . The CSSBB material comparing Lean and Six Sigma states that Lean focuses on reducing waste , while Six Sigma focuses on reducing variation . It also says that when business problems involve a lot of waste, excessive inventories, poor flow, or slow processes, Lean tools should be utilized to eliminate wastes, increase speed, minimize inventories, simplify processes, and improve flows .
That means the Lean problem-solving approach is most appropriate when the project is aimed at identifying and removing non-value-added activities such as waiting, transportation, excess motion, unnecessary inventory, overprocessing, and other forms of muda. DMAIC is the broader Six Sigma improvement framework, and advanced statistical thinking plus variation reduction are more aligned with Six Sigma methodology than with the primary intent of Lean. Therefore, for projects centered on finding and removing waste from the process, the best CSSBB-based answer is A. identification of wastes .
A commuter wants to determine which of two routes to take to work. If route X appears to have more traffic than route Y, the commuter should test which of the following null hypotheses?
Options:
It takes the same amount of time to get to work by route X as by route Y.
It takes more time to get to work by route X than by route Y.
There is a significant difference in the time it takes to get to work by each route.
There is more variation in travel time getting to work by route X than by route Y.
Answer:
AExplanation:
The correct answer is A. It takes the same amount of time to get to work by route X as by route Y . In CSSBB hypothesis testing, the null hypothesis (H0) is typically stated as no difference or equality , while the alternative hypothesis states the suspected difference or effect. The CSSBB examples for two-sample mean tests show the standard null form as H0: μ1 = μ2 and the alternative as H1: μ1 ≠ μ2 or directional inequalities depending on the claim.
Since the commuter suspects that route X may take longer, that suspicion belongs in the alternative hypothesis , not the null. The null should begin from the assumption that the average travel times are the same until evidence suggests otherwise. Option C describes a general alternative statement, not a null. Option D is about variation, not average travel time. Therefore, the proper null hypothesis is that the two routes take the same amount of time on average , which corresponds to option A .
A short-run SPC is used when
Options:
there are small shifts in the mean
a process has demonstrated statistical control
data is collected infrequently or on an aperiodic basis
conventional SPC techniques would be too time-consuming
Answer:
DExplanation:
The correct answer is D. conventional SPC techniques would be too time-consuming . The CSSBB material explains that most traditional SPC techniques require long, reasonably stable production runs . It further states that short-run charting may be desirable when the production lot size is extremely small or when sample sizes are limited. In those situations, using separate conventional control charts for each part number or characteristic can become cumbersome, costly, or impractical. The text specifically notes that alternatives such as first-and-last-piece inspection, 100% inspection, or separate charts for each measurement can be “costly or messy,” which is exactly why short-run SPC methods are used.
Short-run SPC is therefore intended for environments with frequent changeovers, customization, or low-volume production, where standard charting approaches are inefficient. Option C may sound plausible, but the CSSBB source emphasizes small lots and short runs , not merely infrequent data collection. Option A refers to sensitivity to shifts, and option B describes a process condition, not the reason for using short-run SPC. Thus, the best verified answer is D , because short-run SPC is selected when traditional methods are impractical and too burdensome for the situation.
In hypothesis testing, the critical region is represented by
Options:
β
α
1 − β
1 − λ
Answer:
BExplanation:
The correct answer is B. α . In CSSBB hypothesis testing, alpha (α) represents the Type I error risk , which is the probability of rejecting the null hypothesis when it is actually true. The critical region is the rejection region of the hypothesis test, and its total probability under the null hypothesis is equal to α . The CSSBB material illustrates this with two-tailed rejection areas of 0.025 and 0.025 , summing to α = 0.05.
By contrast, β is the probability of failing to reject the null hypothesis when it is false, and 1 − β is the power of the test, which is the probability of rejecting the null hypothesis given that the null hypothesis is false. The CSSBB source states this directly: 1 − β = Probability of rejecting the null hypothesis given that the null hypothesis is false . Therefore, the area used to define the cutoff for rejecting the null hypothesis is represented by alpha , not beta or power. That is why the critical region is correctly represented by B. α .
When measurements are made by reference to a graduated scale, the resulting data are referred to as
Options:
continuous
attribute
discrete
nominal
Answer:
AExplanation:
Data obtained by reading a graduated scale are classified as continuous data because they represent measurements that can take on any value within a range, limited only by the precision of the measuring device. In Six Sigma Measure Phase work, continuous data are generally preferred when available because they provide richer information about process performance than attribute categories. Examples include length, weight, time, pressure, temperature, and diameter measured on a scale or instrument. Attribute data, by contrast, classify items into categories such as pass or fail, yes or no, or defect or no defect. Discrete data are count-based values such as number of errors or number of defects, while nominal data are categorical labels without numeric magnitude. The phrase “measured by reference to a graduated scale” directly indicates a measured variable rather than a counted or classified one. This distinction matters in Black Belt projects because the type of data influences the choice of analysis tools, control charts, capability methods, and sampling approaches. Therefore, the correct answer is A, continuous, because scale-based measurement produces continuously variable data.
===========
The primary benefit of using a project charter is that it
Options:
ensures that the team members understand the causes of issues
provides the project management tools to be used by the team
ensures that stakeholders will support the project
ensures the team will work to meet expectations
Answer:
DExplanation:
The best answer is D. ensures the team will work to meet expectations . The CSSBB source defines a project charter as a written document that defines the team’s mission, scope, objectives, time frames, and consequences. It also states that identifying these details in written form provides a constant and consistent target for the team . The charter’s listed advantages include eliminating confusion, defining boundaries, identifying deliverables, and providing a basis for team goal setting.
That means the charter’s primary benefit is to align the team around what is expected so they can work toward those defined expectations. It does not guarantee stakeholder support, nor does it provide all project management tools. It also does not ensure that team members already understand root causes, since root-cause analysis comes later. While option D is not stated word-for-word in the source, it is the closest interpretation of the charter’s function as a consistent target and expectation-setting document. Therefore, the verified best answer is D .
The Six Sigma problem-solving approach is appropriate for a project that
Options:
focuses on the identification of wastes
requires results in a week or less
requires advanced statistical thinking
has informal teams that manage the process
Answer:
CExplanation:
The Six Sigma problem-solving approach is most appropriate for projects that require advanced statistical thinking. Six Sigma is designed for problems where variation, defect generation, process instability, or complex cause-and-effect relationships must be understood through data and analysis. It is particularly powerful when the team must validate root causes, quantify relationships, assess capability, or optimize performance using statistical tools such as hypothesis testing, regression, design of experiments, and control methods. A project focused primarily on identifying waste may be more directly suited to Lean methods, especially when the issue is speed, flow, or non-value-added activity rather than statistical variation. Projects requiring results in a week or less are often better handled through a kaizen event or rapid improvement activity rather than a full Six Sigma approach. Informal teams are also not the defining condition for Six Sigma use. Black Belt methodology is structured, data-driven, and rigorous. Therefore, the correct answer is C, because Six Sigma is especially appropriate when the problem requires advanced statistical thinking to understand causes and drive sustainable improvement.
===========
In a regression analysis, the prediction interval is used to
Options:
validate the results of the analysis
determine whether a cause and effect relationship exists
replace a confidence interval when n > 30
define a probable range for a single observation
Answer:
DExplanation:
The correct answer is D. define a probable range for a single observation . In the CSSBB regression material, prediction error and the estimation of error variance are discussed as part of building a boundary around predicted values. The text notes that the first step toward acquiring a boundary on a prediction error is estimating the error variance from SSE and degrees of freedom.
This is the purpose of a prediction interval : it gives a likely range for an individual future observation at a given value of the predictor. That is different from a confidence interval, which estimates the likely range of the mean response . The prediction interval is therefore wider because it must account for both uncertainty in the estimated regression line and the natural scatter of individual data points around that line. It is not primarily used to validate the model, prove cause and effect, or replace confidence intervals based on sample size. Therefore, the verified CSSBB-aligned answer is D .
The process of requisitioning, ordering, and obtaining purchased material has been causing conflicts among three different departments. Representatives of each department have formed a cross-functional team to do process mapping to define all the elements of the process and to redesign the process as appropriate. The team has reached agreement on the flaws of the existing process based on the analysis of process data and clear process maps. The next logical step would be for the team to
Options:
develop a design of the revised process
collect data to verify the existing process
implement safeguards to error-proof the existing process
report the team’s recommendations to management
Answer:
AExplanation:
The correct answer is A. develop a design of the revised process . The team has already completed the understanding and diagnosis portion: it mapped the process, analyzed the data, and agreed on the flaws in the current process. The CSSBB supplemental DMAIC overview states that after process mapping and identifying potential causes in Measure, the team moves through Analyze to verify critical factors, and then in Improve the process output is improved by addressing those factors and testing improvements.
That means the next logical step is to design the revised process , not to collect more data on the already verified current state. Error-proofing may become part of the revised design later, but it is not the immediate next step after agreeing on the flaws. Reporting to management may be needed eventually, but first the team needs a well-developed proposed future-state process. Therefore, consistent with CSSBB improvement flow, the next step is to develop a design of the revised process , making A the best answer.
Which of the following documents is intended to keep an improved process in place, prevent process tampering, and transfer ownership to the people who will use the new process?
Options:
A control plan
A control chart
A process change order
A failure mode and effects analysis
Answer:
AExplanation:
The correct answer is A. A control plan . The CSSBB source states that the project control phase is necessary in order to sustain the project gains and that the control plan must remain a living document to monitor and control the process. It also says that a responsible person should be placed in charge of the control plan, and that the process owner is often the best person for that role. In the closing-phase guidance, the source specifically includes identifying the process owner , creating updated work instructions and procedures , training affected personnel , and attaining agreement between the team members and process owner .
These points directly support the idea of keeping the improved process in place and transferring ownership to those who will use and maintain it. A control chart is only one monitoring tool, not the full sustainment document. A process change order is an administrative record, and FMEA is a risk-analysis tool. Therefore, the document intended to sustain the gains, discourage tampering, and hand off responsibility is the control plan . The verified answer is A .
Which of the following is an acceptable way to reduce the number of options in a solution selection matrix?
Options:
Brainstorming
Affinity diagramming
Multivoting
Process mapping
Answer:
CExplanation:
The correct answer is C. Multivoting . The CSSBB source explains that multivoting is a popular method used to select the most important items from a previously generated list when there are too many items for a team to work on at one time . It specifically states that the purpose is to narrow the field to a few items worthy of immediate attention, after which the items with the fewest votes are eliminated.
That is exactly what the question is asking: an acceptable way to reduce the number of options before or during use of a solution selection matrix. Brainstorming is useful for generating options, not narrowing them. Affinity diagramming organizes ideas into groups, and process mapping documents process flow. Neither of those is primarily a tool for reducing a long options list to a smaller set for decision-making. Multivoting is widely used in Six Sigma team decision processes because it is simple, participative, and effective for screening alternatives. Therefore, the verified answer is C. Multivoting .
What is the primary function of process control charts?
Options:
Determining the mean operating point of process variables
Identifying possible problems or unusual incidents in a process
Verifying that the process capability is above target
Maintaining the proper relationship between specification limits and control limits
Answer:
BExplanation:
The correct answer is B. Identifying possible problems or unusual incidents in a process . The CSSBB source states that control charts are the most powerful tools to analyze variation in most processes and that a process in statistical control is predictable because points do not exceed the control limits. The practical purpose of the chart is to highlight signals of special or assignable causes , which represent unusual conditions or potential problems requiring investigation.
Control charts are not primarily used to verify that capability is above target; capability analysis is a separate concept. They also do not maintain a relationship between control limits and specification limits, since CSSBB materials explicitly distinguish control limits from specification limits. Control charts may help estimate whether the process mean is stable, but that is not their main function. Their primary value is detecting when the process behavior changes in a meaningful way, so corrective action can be taken before more defects occur. Therefore, the best verified CSSBB answer is B , because control charts are fundamentally designed to identify possible problems or unusual process incidents.
Gauge traceability requires an unbroken chain of calibrations from each gauge to
Options:
a single set of standards used throughout the entire organization
a certified standard that has a valid relationship to national or international standards
an internal company standard that is correlated with appropriate ISO standards
an internal company standard that is correlated with the standard recommended by the gauge manufacturer
Answer:
BExplanation:
The correct answer is B. a certified standard that has a valid relationship to national or international standards . In the CSSBB metrology and calibration material, calibration standards are described in levels, culminating in national and international standards , which are identified as the final authority of measurement to which all standards are traceable . The text also explains that working-level gauges are connected through an unbroken hierarchy of calibration standards, functional standards, and reference standards until they ultimately trace back to recognized national and international authorities.
This means traceability is not merely an internal company relationship or a manufacturer recommendation. It must connect to an accepted certified standard whose validity can be linked to recognized national or international standards, such as NIST-related references. Option A is too narrow because an organization-wide standard alone is not enough unless it is itself traceable upward. Options C and D are also insufficient because internal correlation does not establish full metrological traceability. In Six Sigma measurement systems, confidence in data depends on this documented calibration chain. Therefore, the correct and verified answer is B .
One of the most effective ways of identifying a product’s internal and external customers is to
Options:
interview the sales force
hold customer focus groups
conduct blind surveys throughout the entire market
develop and analyze a flow diagram with a cross-functional team
Answer:
DExplanation:
Developing and analyzing a flow diagram with a cross-functional team is one of the most effective ways to identify both internal and external customers. In the Define Phase, Black Belts must understand the process as a system, including who receives outputs at each step and who depends on those outputs. A cross-functional flow diagram makes those relationships visible by showing how work moves across departments, interfaces, and handoffs. This helps the team identify internal customers such as downstream functions, support groups, approvers, and operators, as well as the ultimate external customer who receives the final product or service. Interviewing the sales force may provide useful customer insight, but it is incomplete and often biased toward external-market views. Focus groups and blind surveys can gather voice-of-the-customer information, but they do not systematically reveal internal customer relationships embedded in the process flow. A cross-functional diagram is stronger because it identifies the full chain of suppliers, inputs, process steps, outputs, and customers. Therefore, the correct answer is D.
===========
During the Improve phase, a computer simulation can be used to
Options:
Answer:
reduce experiment variability
Answer:establish process capability
Answer:predict physical test results
Answer:prove cycle-time increase
Answer:C
The correct answer is C. predict physical test results . In the CSSBB Improve-phase implementation material, simulation is defined as a time-dependent trial of a new product, process, or system , often accomplished through mathematical or computer-based modeling . It is used when an actual demonstration is too difficult, time-consuming, expensive, massive, or dangerous.
That means simulation is used to estimate or predict how a proposed process or product will behave without physically running the full test . This aligns best with predicting physical test results. Simulation does not directly reduce experiment variability, nor is it the primary method for establishing process capability. It also would not be used to “prove cycle-time increase,” especially since improvement projects generally seek cycle-time reduction, not increase. In Six Sigma, simulation is a practical way to explore likely process performance and implementation effects before committing to full-scale testing or rollout. Therefore, the verified answer is C .
Which of the following distributions contains more observations below the average than above the average?
Options:
Gaussian
Exponential
Binomial
Hypergeometric
Answer:
BExplanation:
The exponential distribution is the correct answer because it is positively skewed, with many observations clustered near lower values and a long tail extending to the right. In such a distribution, the mean is pulled to the right by the tail, which results in more observations falling below the average than above it. This is different from a Gaussian distribution, which is symmetric and has equal balance around the mean. Binomial and hypergeometric distributions may take different shapes depending on their parameters, but they are not generally identified by the specific property described in the question. In Six Sigma Measure Phase applications, the exponential distribution is commonly associated with waiting times, time between events, and reliability-type processes. Because its shape is strongly right-skewed, the average is not the midpoint of the data in the way it is for a normal distribution. This makes the statement in the question characteristic of exponential behavior. Therefore, the correct answer is B, Exponential, because its skewed form causes a majority of observations to lie below the mean while relatively fewer high values extend the distribution to the right.
Which of the following decision-making styles promotes distributed participation, equalization of power, productive controversy, cohesion, involvement, and commitment?
Options:
Subgroup
Consultative
Transactional
Consensus
Answer:
DExplanation:
Consensus is the decision-making style that best promotes distributed participation, equalization of power, productive controversy, cohesion, involvement, and commitment. In Six Sigma team management, consensus does not mean that every team member gets exactly what he or she wants. Instead, it means the team works through differences openly, considers multiple viewpoints, and reaches a decision that all members can support and commit to implementing. This approach is especially important in cross-functional Black Belt teams, where success depends on collaboration across departments, subject-matter perspectives, and different levels of authority. Consensus supports stronger buy-in because people are more likely to support decisions they helped shape. It also improves decision quality by allowing constructive disagreement and surfacing concerns before implementation. A subgroup approach can fragment the team, consultative styles may still centralize authority, and transactional approaches focus more on exchanges than shared ownership. In Six Sigma project environments, consensus is valuable because it strengthens commitment to action, encourages participation, and helps build durable alignment around project decisions. Therefore, the correct answer is Consensus.
===========
Rank in order, from first to last, the steps a quality improvement team should take when conducting a benchmarking study.
Identify the areas to be improved
Flowchart current process
Investigate how others are doing
Initiate new process
Develop plans for application
Options:
1,2,4,3,5
1,3,2,4,5
2,1,3,5,4
2,5,3,1,4
Answer:
CExplanation:
The correct sequence is 2,1,3,5,4. A benchmarking study begins with understanding the current process, which is why flowcharting the current process comes first. The team must know how work is presently done before it can intelligently compare performance or practices against others. Next, the team identifies the areas to be improved, focusing the benchmarking effort on the most meaningful gaps or opportunities. After that, the team investigates how others are doing, gathering external or internal comparative information about best practices and superior performance methods. Once those findings are understood, the team develops plans for application, translating what was learned into a realistic implementation approach suited to its own environment. Finally, the team initiates the new process by putting the adapted improvements into action. This sequence reflects disciplined organizational learning: understand yourself first, define the target areas, study others, plan adaptation, and then implement. In Black Belt work, benchmarking is not imitation for its own sake; it is structured comparison followed by thoughtful application. Therefore, the correct answer is 2,1,3,5,4.
===========
A team developed the following plot to compare residuals versus fitted values. On the basis of this plot, which of the following conclusions can be drawn, if any?
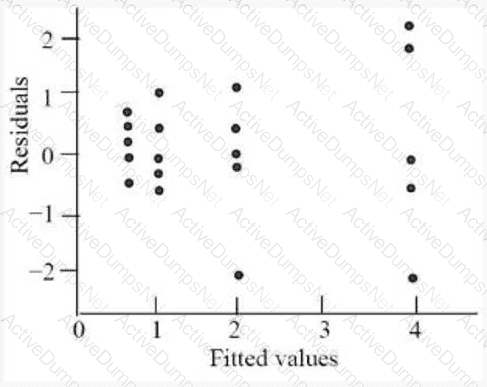
Options:
The variances are equal.
The variance is decreasing.
The variance is increasing.
There is insufficient information to draw a conclusion.
Answer:
CExplanation:
A residuals-versus-fitted plot is used in the Analyze Phase to check model assumptions, especially constant variance. If the spread of the residuals grows as the fitted values increase, the plot indicates nonconstant variance, also called heteroscedasticity. In this figure, the residuals at lower fitted values are relatively clustered, while at higher fitted values the points spread farther apart vertically. That widening pattern shows that the amount of variation increases as the fitted value increases.
This means the equal-variance assumption is not supported. It is also not decreasing, because the spread clearly becomes larger rather than smaller. The plot provides enough visual evidence to make a conclusion, so “insufficient information” is not the best choice. In Six Sigma statistical analysis, this kind of pattern is important because increasing variance can weaken model validity, distort significance tests, and reduce confidence in predictions. A Black Belt would usually investigate transformation, model refinement, or subgroup effects when this pattern appears. Therefore, the correct answer is C, because the residual plot shows that the variance is increasing as fitted values increase.
Which of the following Theory of Constraints (TOC) elements is designed to decrease inventory or investment?
Options:
A reduction in work-in-process
A reduction in cycle time
An increase in repeat business
An increase in total sales
Answer:
AExplanation:
The correct answer is A. A reduction in work-in-process . In the CSSBB materials, TOC uses three primary system measures: throughput , inventory , and operational expenses . Inventory is defined as all the money the system has invested in purchasing things it intends to sell, or in practical terms, money that is tied up inside the system rather than converted into sales. Reducing work-in-process (WIP) directly lowers the amount of material and partially completed work sitting in the process, which reduces the amount of money trapped in inventory or investment.
This is fully aligned with TOC thinking because bottlenecks and poor flow tend to increase queue sizes and WIP. The CSSBB source stresses balancing flow with market demand rather than maximizing local utilization, which helps prevent excess buildup of inventory. While reducing cycle time can be beneficial, it is not as directly tied to decreasing inventory as reducing WIP. Increasing repeat business or total sales relates more to throughput generation than to reducing internal investment. Therefore, the TOC element most clearly designed to decrease inventory or investment is a reduction in work-in-process .
Which of the following factors is a consideration in design for maintainability?
Options:
Frequency of scheduled servicing
Product failure modes
Variability of process inputs
Number of customer complaints
Answer:
AExplanation:
The correct answer is A. Frequency of scheduled servicing . In the CSSBB DFSS and maintainability material, maintainability is associated with designing products so they can be easily serviced, repaired, restored, and kept available. The CSSBB source lists maintainability-related guidelines such as standardization , modularization , accessibility , fault isolation , interchangeability , and methods of recording corrective and preventive maintenance . These considerations are all tied to how easily and efficiently the product can be maintained over its life.
Among the answer choices, the factor that best fits maintainability thinking is the frequency of scheduled servicing , because maintainability addresses how often service is needed and how easily that service can be performed. Product failure modes are more directly associated with reliability and FMEA. Variability of process inputs relates more to robust design and process capability. Number of customer complaints is an outcome metric, not a design-for-maintainability factor. Since maintainability focuses on serviceability and ongoing upkeep, the best CSSBB-based answer is A. Frequency of scheduled servicing .
Two catalysts are being analyzed to compare their effect on the yield of a chemical process. Catalyst 1 is currently being used, and catalyst 2 is being considered as it is a less expensive alternative, provided the yield is the same. An experiment is run with 10 observations for each catalyst and t = -1.06. Assuming equal variances and α = 0.05, which of the following conclusions can be made?
Options:
t0.025,18 = -2.101 < -1.06 < 2.101, and yields are different
t0.025,18 = -2.101 < -1.06 < 2.101, and yields are not different
t0.05,18 = -1.734 < -1.06 < 1.734, and yields are different
t0.05,18 = -1.734 < -1.06 < 1.734, and yields are not different
Answer:
BExplanation:
This is a two-sample t-test situation comparing the mean yields of two catalysts, with 10 observations in each sample and equal variances assumed. The degrees of freedom are n1 + n2 - 2 = 18. Because the question asks whether the yields are the same and uses α = 0.05, the appropriate test is a two-tailed t-test with critical values at ±t0.025,18, which is approximately ±2.101. The observed test statistic is t = -1.06. Since -1.06 lies between -2.101 and +2.101, the result falls inside the nonrejection region. Therefore, the null hypothesis of equal means is not rejected. In Six Sigma Analyze Phase work, this means the available data do not provide sufficient evidence that the two catalyst yields are different. That does not prove the yields are exactly identical in a practical sense, but it does mean there is no statistically significant difference detected at the 0.05 level. Since catalyst 2 is less expensive and yield appears statistically equivalent based on this test, it may be considered a viable alternative pending any additional operational considerations. Therefore, the correct answer is B.
===========
The following stem-and-leaf plot was developed from sample data.

What is the median value for this sample?
Options:
48.0
51.0
51.6
53.5
Answer:
BExplanation:
The correct answer is B. 51.0 . In the CSSBB material, a stem-and-leaf plot is a manual method for arranging data into ordered groups, with the stem representing the leading digits and the leaf representing the trailing digits. Once the data are arranged in order, the median is the middle value. The CSSBB source states that for an even number of observations, the median is the average of the middle two values .
From the stem-and-leaf plot, the ordered data are:
36, 44, 46, 48, 48, 48, 50, 51, 51, 52, 53, 54, 57, 61, 63, 64
There are 16 values , so the median is the average of the 8th and 9th values. Those values are 51 and 51 .
Median = (51 + 51) / 2 = 51.0
This is why option B is correct. The stem-and-leaf plot is especially useful in Six Sigma because it preserves the original data values while making it easy to identify central tendency, spread, and potential patterns in the sample.
A stable, normally distributed process has a mean of 503 and a standard deviation of 4. If the specification is 500 ± 10, with a target of 500, what is the Cpm value?
Options:
0.13
0.58
0.67
0.83
Answer:
CExplanation:
The correct answer is C. 0.67. The CSSBB source defines the Cpm index as the Taguchi-based capability index that includes both process variation and the distance of the process mean from the target. It is given by:
Cpm = (USL − LSL) / [6 × √(σ² + (μ − T)²)]
From the question:
USL = 510, LSL = 490, so USL − LSL = 20
σ = 4
μ = 503
T = 500
Now compute:
σ ² + ( μ − T)² = 4² + (503 − 500)² = 16 + 9 = 25
√25 = 5
Denominator = 6 × 5 = 30
So:
Cpm = 20 / 30 = 0.667
Rounded to two decimal places, this is 0.67, which matches option C. The CSSBB material notes that Cpm places more emphasis on how well the process is centered on the target, not just on spread within specifications. Since this process is off target by 3 units, the Cpm is reduced accordingly. Therefore, the verified answer is C.
A customer focus group is the most effective way for a company to
Options:
measure customer satisfaction rates
convert customer requirements to product specifications
gain a deeper understanding of customer needs
review customers’ complaints
Answer:
CExplanation:
The correct answer is C. gain a deeper understanding of customer needs. The CSSBB customer-focus material explains that organizations need a deep knowledge and understanding of the customer and must go beyond superficial feedback to uncover what customers truly want. It also states that companies can use focus groups, along with interviews and surveys, to identify customer needs and expectations. In related VOC material, focus groups are specifically listed as one of the ways a company can listen to the voice of the customer.
A focus group is especially effective for exploring perceptions, motivations, unmet needs, and reactions in depth through interactive discussion. Measuring satisfaction rates is more directly associated with surveys and quantitative metrics. Converting requirements into product specifications is the role of QFD, not the focus group itself. Reviewing complaints provides useful feedback, but it is narrower and more reactive than exploring broader customer needs. Therefore, the most accurate CSSBB-based answer is C. gain a deeper understanding of customer needs.
Creating a training plan to sustain an improved process will ensure that the new process
Options:
is understood by the workers who use it
is used to identify other constraints in the system
has a complete control plan
has buy-in by the workers and process owner
Answer:
AExplanation:
The correct answer is A. is understood by the workers who use it . The CSSBB control-phase training-plan material states that after a new or revised process is created, training deployment must identify who needs training in order to sustain and maintain the change . It further says that all affected personnel should receive hands-on training on not only what must be done differently , but also why it is necessary. The same section adds that employees must understand the benefits of the process changes, their responsibilities, expectations, and how to do the task consistently.
This directly supports option A. Training is intended to ensure that the people who operate the process understand the new method well enough to perform it consistently and maintain the improvement. Training may help acceptance and support the control plan, but its clearest and most direct effect is process understanding by the users. It is not primarily for identifying other system constraints. Therefore, the best verified answer is A. is understood by the workers who use it .
The primary reason for identifying both the internal and external customers of a process is to
Options:
estimate financial costs of meeting customer needs
motivate teams to work more efficiently with the customers
incorporate Lean into the organizational culture
understand how the customers interact with the process
Answer:
DExplanation:
The correct answer is D. understand how the customers interact with the process . The CSSBB source explains that both internal and external customers must be identified, along with their requirements, in order to understand and improve the business process . The SIPOC model reinforces this by showing the relationship among suppliers, inputs, process, outputs, and customers , helping the team see how outputs connect to customers and how the process affects them.
This is the main reason for identifying all customer groups: the team must understand who receives the output, what they require, and how they are connected to the process flow. Internal customers often represent the next downstream operation, while external customers are the ultimate users or buyers. If either group is ignored, the team can misunderstand the true requirements and improve the wrong part of the process. The other options are secondary or unrelated. Customer identification is not primarily about estimating cost, motivating the team, or building Lean culture. It is fundamentally about understanding the process-customer relationship so requirements can be translated correctly into improvement actions. Therefore, D is the verified answer.
What methodology focuses on improving customer satisfaction by decreasing defects, variation, cycle time, and waste?
Options:
Total quality management
Lean Six Sigma
PDCA
Kaizen
Answer:
BExplanation:
Lean Six Sigma is the methodology that directly combines defect reduction, variation reduction, cycle-time improvement, and waste elimination in a unified approach focused on customer satisfaction. Six Sigma contributes statistical rigor, process capability improvement, and variation control, while Lean contributes speed, flow, waste reduction, and value-added focus. Together, they address both effectiveness and efficiency. This combined methodology is widely used to improve quality, lower cost, shorten lead time, and strengthen customer experience by aligning processes with what customers truly value. Total quality management is broader and more cultural, PDCA is a general improvement cycle, and Kaizen emphasizes continuous incremental improvement. While each of those supports quality improvement, Lean Six Sigma is the specific methodology that explicitly targets defects, variation, cycle time, and waste together. In CSSBB practice, this integrated approach is essential because customer dissatisfaction often results from a combination of poor quality, slow processes, inconsistency, and non-value-added activity. Therefore, the correct answer is Lean Six Sigma, since it best matches the full set of improvement objectives described in the question.
===========
In measurement system analysis, both the 10:1 rule and the 4:1 rule are based on the
Options:
specification tolerance
process control limits
gage replacement costs
calibration intervals
Answer:
AExplanation:
The correct answer is A. specification tolerance . In CSSBB measurement system analysis, one of the standard ways to evaluate a gage is to compare measurement-system variation against the tolerance , using the precision-to-tolerance capability ratio :
CR = 6σ / (USL − LSL)
This shows that the rule-of-thumb criteria used for judging adequacy are based on the relationship between measurement variation and the specification tolerance band . The well-known 10:1-type thinking in gage selection likewise comes from comparing measurement discrimination or variation to tolerance, not to control limits, replacement cost, or calibration interval. Process control limits are statistical limits derived from process behavior, whereas MSA adequacy rules concern whether the measurement system is fine enough relative to engineering requirements.
So even if the exact rule wording varies by context, both rules are grounded in the same idea: the gage must be sufficiently capable relative to the specification tolerance . Therefore, the verified best answer is A .
A Black Belt is managing a team that encounters an organizational problem caused by conflicting management goals. To help resolve this situation, the Black Belt should do which of the following first?
Options:
Ask the team to prioritize the conflicting goals
Facilitate a meeting with the managers whose goals are in conflict
Instruct the team to ignore the conflict
Prioritize the goals in terms of the seniority of the managers
Answer:
BExplanation:
The correct answer is B. Facilitate a meeting with the managers whose goals are in conflict . In CSSBB team management, the facilitator and team leader are expected to support conflict resolution , reinforce participation, and help the right people address issues that affect team progress. The team-meeting guidance specifically includes conflict resolution as part of effective meeting structure and asks teams to define how conflict will be managed.
Because this conflict is caused by management goals , the issue is above the team’s authority level and should be addressed directly with the managers involved. Asking the team to prioritize management goals would push the team into a decision that belongs to leadership. Ignoring the conflict would allow misalignment to continue, and ranking goals by manager seniority is not a sound Six Sigma approach. The first step should be to bring the relevant managers together in a structured discussion so the competing goals can be clarified, aligned, or escalated appropriately. Therefore, the best CSSBB-based answer is B .
When a team is performing an analysis of variance (ANOVA), which of the following conditions would indicate the need to transform the data?
Options:
There is evidence of outliers in the raw data.
The residuals indicate a non-constant variance.
The residuals show patterns of completely random behavior.
A normal probability plot of residuals exhibits a completely linear relationship.
Answer:
BExplanation:
The correct answer is B. The residuals indicate a non-constant variance . ANOVA assumes that residuals are approximately normal and that the variance is reasonably constant across groups. When residual plots show non-constant variance , this signals a violation of model assumptions and often indicates that the data should be transformed before interpreting the ANOVA results. The CSSBB materials note that when data are not normal or do not satisfy assumptions for analyses such as t-tests, ANOVA, and process capability , one appropriate action is to transform the data , often using a logarithmic or other power transformation. The CSSBB source also discusses common transformations such as log, square root, exponential, and reciprocal, with Box-Cox cited as a useful technique for finding an appropriate transformation.
By contrast, completely random residual behavior is generally desirable because it suggests no obvious pattern remains. A completely linear normal probability plot also supports the adequacy of the assumptions. Outliers may require investigation, but they do not automatically imply that transformation is the right response. The clearest indicator here is non-constant variance , so B is the verified best answer.
A process improvement team should set ground rules in order to
Options:
ensure that team members attend meetings
avoid having to vote on every issue presented
identify who should participate in discussions
prevent misunderstandings
Answer:
DExplanation:
The correct answer is D. prevent misunderstandings . In the CSSBB-aligned facilitation material, the facilitator uses ground rules to manage team member behaviors and to ensure both an efficient and effective meeting . Ground rules set expectations for how people will communicate, participate, listen, stay on topic, and handle disagreements. Because those expectations are made explicit in advance, they help reduce confusion and avoid misinterpretation about how the team will work together.
Ground rules are not primarily created to force attendance, determine voting frequency, or decide who is allowed to speak. Instead, they create a shared framework for respectful interaction and decision-making. In Six Sigma teams, this matters because projects often involve cross-functional members with different priorities, communication styles, and assumptions. Without agreed rules, side conversations, interruptions, or unclear behavior norms can quickly create conflict and misunderstanding. By setting clear expectations early, the team improves communication quality and reduces the risk of process and relationship problems during meetings. Therefore, the best CSSBB-based answer is D. prevent misunderstandings .
Which of the following factors is essential to the success of any project?
Options:
A matrix organizational structure
A multi-departmental project team
Recruitment of the best available people
Support from senior management
Answer:
DExplanation:
Support from senior management is essential to the success of any project because leadership provides direction, authority, resources, visibility, and organizational alignment. In Six Sigma deployment, projects often require cross-functional cooperation, time allocation, data access, process changes, and sometimes conflict resolution across departments. Without active support from senior management, even technically strong projects can stall due to lack of priority, weak sponsorship, insufficient resources, or resistance to change. A matrix structure, a multi-departmental team, and strong people all can help, but none of them substitutes for committed leadership backing. Senior management support also reinforces the strategic relevance of the project, ensuring that improvement work is connected to business objectives rather than treated as an isolated local activity. This support helps remove barriers, secure process-owner engagement, and sustain improvements after project completion. In Black Belt practice, successful projects nearly always depend on visible leadership commitment. Therefore, the correct answer is D, Support from senior management, because it creates the organizational conditions necessary for the team to execute, implement, and sustain meaningful improvement.
===========
Based on the normal distribution shown, approximately what percentage of the data fall within one standard deviation of the mean?
Options:
34%
67%
95%
99.7%
Answer:
BExplanation:
In a normal distribution, approximately 68% of the data fall within plus or minus one standard deviation of the mean. Since the answer choices use 67% rather than 68%, the best available choice is B. This result comes from the well-known empirical rule used in Six Sigma and basic statistics: about 68% of observations lie within one standard deviation, about 95% lie within two standard deviations, and about 99.7% lie within three standard deviations. In the Measure Phase, this rule is important because it helps Black Belts interpret process spread, understand variation, and quickly estimate how data are distributed around the average. It also supports capability thinking and helps teams relate standard deviation to expected process behavior under normality assumptions. This is especially useful when reviewing histograms, bell curves, and control-chart concepts. Therefore, for a normal distribution, the percentage within one standard deviation is approximately 68%, which corresponds to choice B, 67%, as the nearest listed answer.
===========
Unlock CSSBB Features
- CSSBB All Real Exam Questions
- CSSBB Exam easy to use and print PDF format
- Download Free CSSBB Demo (Try before Buy)
- Free Frequent Updates
- 100% Passing Guarantee by Activedumpsnet
Questions & Answers PDF Demo
- CSSBB All Real Exam Questions
- CSSBB Exam easy to use and print PDF format
- Download Free CSSBB Demo (Try before Buy)
- Free Frequent Updates
- 100% Passing Guarantee by Activedumpsnet